Download
1 / 38
380 likes | 384 Vues
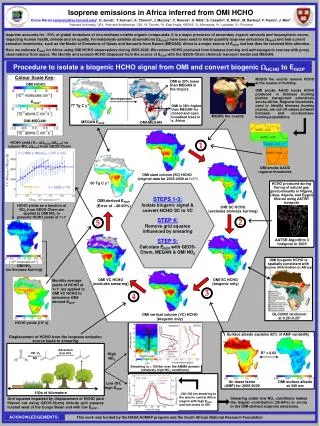
This study examines the traffic-related emissions of formaldehyde (HCHO) and nitrous acid (HONO) in Los Angeles during the CalNex campaign. The results show an increase in HCHO and HONO during rush hours and a higher HCHO/CO and HONO/CO ratio compared to roadside measurements in Houston.

E N D
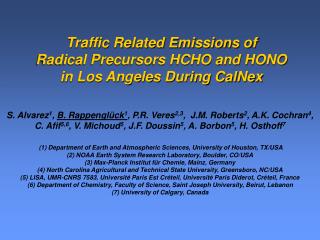
Traffic Related Emissions of Radical Precursors HCHO and HONO in Los Angeles During CalNex S. Alvarez1, B. Rappenglück1, P.R. Veres2,3, J.M. Roberts2, A.K. Cochran4, C. Afif5,6, V. Michoud5, J.F. Doussin5, A. Borbon5, H. Osthoff7 (1) Department of Earth and Atmospheric Sciences, University of Houston, TX/USA (2) NOAA Earth System Research Laboratory, Boulder, CO/USA (3) Max-Planck Institut für Chemie, Mainz, Germany (4) North Carolina Agricultural and Technical State University, Greensboro, NC/USA (5) LISA, UMR-CNRS 7583, Université Paris Est Créteil, Université Paris Diderot, Créteil, France (6) Department of Chemistry, Faculty of Science, Saint Joseph University, Beirut, Lebanon (7) University of Calgary, Canada
Sources of OH • early morning • midmorning • afternoon nm nm
Secondary formation through photochemical breakdown of anthropogenic and biogenic VOCs. Primary emission through incomplete combustion. Potential sources: mobile sources (traffic exhaust) point sources (in petrochemical production). Formation of Formaldehyde (HCHO) Formation of Nitrous Acid (HONO) • Gas phase • NO + OH → HONO • Heterogeneous formation • 2NO2 + H2O → HONO + HNO3 • Photo-enhanced heterogeneous reactions • Primary emission through combustion processes
Traffic Related Emissions of HONO and HCHO • So far only scarce traffic emissions data is available which includes both compounds. `
Traffic Related Emissions of HONO and HCHO • So far only scarce traffic emissions data is available which includes both compounds. • In particular for HONO traffic related data was obtained more than a decade ago. - mostly in Europe - tunnel measurements (heavy duty vehicles?) `
Traffic Related Emissions of HONO and HCHO • So far only scarce traffic emissions data is available which includes both compounds. • In particular for HONO traffic related data was obtained more than a decade ago. - mostly in Europe - tunnel measurements (heavy duty vehicles?) • However, this knowledge is needed to further refine and validate air quality modeling. `
Traffic Related Emissions of HONO and HCHO • So far only scarce traffic emissions data is available which includes both compounds. • In particular for HONO traffic related data was obtained more than a decade ago. - mostly in Europe - tunnel measurements (heavy duty vehicles?) • However, this knowledge is needed to further refine and validate air quality modeling. • Primary goal: HCHO/CO, HONO/CO (CO: traffic marker) `
Measurements CalNex Pasadena Site
Measurements CalNex Pasadena Site CalNex Pasadena Site
Measurements CalNex Pasadena Site CalNex Pasadena Site
Day (6 am – 8 pm) Night (8 pm – 6 am) CO Night Day
Day (6 am – 8 pm) Night (8 pm – 6 am) PAN Night Day
Day (6 am – 8 pm) Night (8 pm – 6 am) HCHO Night Day
Day (6 am – 8 pm) Night (8 pm – 6 am) HONO Night Day
Evening rush hour Morning rush hour
Morning rush hour Morning
Noon Morning rush hour Morning Noon
Noon Evening rush hour Morning rush hour Evening Morning Noon
Evening Morning Noon
Evening Morning Noon
Evening rush hour Morning rush hour Evening Morning Noon
8:00-10:00 pm 4:30-6:00 am Time frames taken for correlation analysis Evening Morning
HCHO vs CO (weekdays) 4:30-6:00 am (PAN < 300 ppt)
HCHO vs CO (weekdays) 4:30-6:00 am (PAN < 300 ppt) 4:30-6:00 am and 8:00-10:00 pm (PAN < 300 ppt)
HCHO vs CO (weekdays) 4:30-6:00 am (PAN < 300 ppt) 4:30-6:00 am and 8:00-10:00 pm (PAN < 300 ppt) Comparison: Houston/TX Highway Junction 07/15-10/15/09 y = 2.66(±0.13) – 140.0(±45.3) R2=0.75 y = 2.98(±0.13) + 484.5(±46.1) R2=0.69 (i) weekdays (ii) rush hour time 5:00-9:00 am (iii) global radiation < 10 Wm-2 (iv) PAN < 50 ppt (v) no precipitation (vi) RH > 80% CalNex-Pasadena “higher”
HONO vs CO (weekdays) 4:30-6:00 am (PAN < 300 ppt)
HONO vs CO (weekdays) 4:30-6:00 am (PAN < 300 ppt) 4:30-6:00 am and 8:00-10:00 pm (PAN < 300 ppt)
HONO vs CO (weekdays) 4:30-6:00 am (PAN < 300 ppt) 4:30-6:00 am and 8:00-10:00 pm (PAN < 300 ppt) Comparison: Houston/TX Highway Junction 07/15-10/15/09 y = 2.66(±0.13) – 140.0(±45.3) R2=0.75 (i) weekdays (ii) rush hour time 5:00-9:00 am (iii) global radiation < 10 Wm-2 (iv) PAN < 50 ppt (v) no precipitation (vi) RH > 80% CalNex-Pasadena “higher”
HCHO and HONO traffic related emissions during CalNex; preliminary results: • Increase of HCHO and HONO during rush hour(s) • HCHO <> CO ratio: slope around 3.5 - 4.9 pptv HCHO/ 1 ppbv CO • HONO <> CO ratio: slope around 3.3 - 4.2 pptv HONO/ 1 ppbv CO • Higher than in roadside study in Houston But: in Houston: PAN < 50 ppt; in CalNex-Pasadena: PAN < 300 ppt) - CalNex-Pasadena: more aged air masses? - Traffic composition? - Traffic flow?
HCHO and HONO traffic related emissions during CalNex; preliminary results: • Increase of HCHO and HONO during rush hour(s) • HCHO <> CO ratio: slope around 3.5 - 4.9 pptv HCHO/ 1 ppbv CO • HONO <> CO ratio: slope around 3.3 - 4.2 pptv HONO/ 1 ppbv CO • Higher than in roadside study in Houston But: in Houston: PAN < 50 ppt; in CalNex-Pasadena: PAN < 300 ppt) - CalNex-Pasadena: more aged air masses? - Traffic composition? - Traffic flow? • What next? • HONO: final QA, inclusion of additional HONO data (NOAA) • PAN: filling gaps in PAN data (GC?) • Merging with VOC and NOx data • Source apportionment • Comparison with MOBILE6 / MOVES2010 traffic emissions modeling
HCHO and HONO traffic related emissions during CalNex; preliminary results: • Increase of HCHO and HONO during rush hour(s) • HCHO <> CO ratio: slope around 3.5 - 4.9 pptv HCHO/ 1 ppbv CO • HONO <> CO ratio: slope around 3.3 - 4.2 pptv HONO/ 1 ppbv CO • Higher than in roadside study in Houston But: in Houston: PAN < 50 ppt; in CalNex-Pasadena: PAN < 300 ppt) - CalNex-Pasadena: more aged air masses? - Traffic composition? - Traffic flow? • What next? • HONO: final QA, inclusion of additional HONO data (NOAA) • PAN: filling gaps in PAN data (GC?) • Merging with VOC and NOx data • Source apportionment • Comparison with MOBILE6 / MOVES2010 traffic emissions modeling Acknowledgements: • NOAA: Roberts et al., Borbon et al., Osthoff • JJJ: Alvarez, Rappenglück
weekend weekend