Download
1 / 22
220 likes | 331 Vues
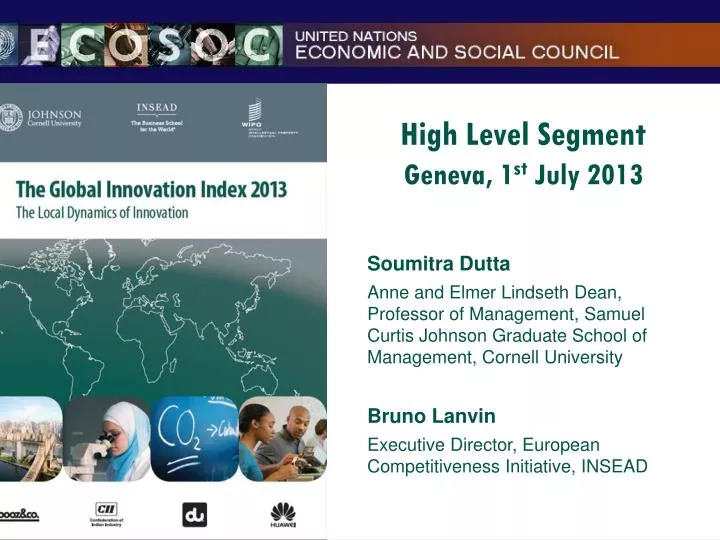
High Level Segment Geneva, 1 st July 2013. Soumitra Dutta Anne and Elmer Lindseth Dean, Professor of Management, Samuel Curtis Johnson Graduate School of Management, Cornell University Bruno Lanvin Executive Director, European Competitiveness Initiative, INSEAD.

E N D
High Level Segment Geneva, 1st July 2013 Soumitra Dutta Anne and Elmer Lindseth Dean, Professor of Management, Samuel Curtis Johnson Graduate School of Management, Cornell University Bruno Lanvin Executive Director, European Competitiveness Initiative, INSEAD
The GII is a multi-stakeholder effort • Co-published by Cornell University, INSEAD and WIPO • Four Knowledge Partners: Booz & Company, the Confederation of Indian Industry, du, and Huawei • Independent statistical audit by the Joint Research Centre of the European Commission • International advisory board
GII 2013 – Main results • Innovation is a global game • An innovation divide persists • Local dynamics are key • Policy implications emerge
GII 2013 rankings – Top 10 GII Efficiency Ratio Output Sub-Index Input Sub-Index Singapore Hong Kong (China) United States of America United Kingdom Sweden Finland Switzerland Denmark Canada Netherlands Switzerland Netherlands Sweden United Kingdom Malta Luxembourg Iceland Finland Israel Germany Mali Moldova, Rep. Guinea Malta Swaziland Indonesia Nigeria Kuwait Costa Rica Venezuela, Bolivarian Rep. Switzerland Sweden United Kingdom Netherlands United States of America Finland Hong Kong (China) Singapore Denmark Ireland
Mapping the GII rankings is not the whole story
The local dynamics of innovation • Despite the economic crisis, innovation is alive and well. Research and development spending levels are surpassing 2008 levels in most countries. • The theme of the GII 2013 is on ‘the local dynamics of innovation’. Seven analytical chapters shed light on the factors leading to the excellence of innovation hubs, the role of local ‘champions, the interaction of clusters with local, inter-regional, and global networks and value chains, with examples from India, Uruguay, the Middle East and Northern Africa, and Europe, among others. • Local dynamics are bustling in established hubs such as Baden-Württemberg in Germany, the Capital Region of the Republic of Korea, Guangdong Province in China, StredniCechy in the Czech Republic, the Mumbai region in India, Tel Aviv in Israel, São Paulo in Brazil, etc. • The report signals a shift from the tendency to duplicate successful initiatives. Original innovation ecosystem are thriving around the world. • In New York City, Cornell University and the Technion – Israel Institute of Technology were invited to set up the NYC Tech Campus on Roosevelt Island, aimed at attracting a new talent pool, lead to innovation, and impact the economy of the surrounding region.
A benchmark for policymakers Measuring innovation is a moving target. The GII helps identify targeted policies, good practices, and other levers to foster innovation. Country profiles include strengths and weaknesses. The GII rankings attract media attention, but they are not the main part of the GII.
A persistent innovation divide Striking pattern of stability at the top. Switzerland comes 1st and Sweden 2nd since 2011. The top 10 or top 25 might swap rankings, but not a single country moved in or out this year. Rankings remain strongly correlated with income levels.
Some regional gaps have been reduced Median ranks in Human capital and research, and Infrastructure present the expected shape, but some gaps have been bridged in the remaining pillars (red arrows). For example, the median Sub-Saharan African country performs better than the median Central and Southern Asian country in Institutions, Business sophistication and Creative outputs.
Policy implications • Innovation is a mindset – It requires the identification and mobilization of multiple resources, and hence the engagement of a multiplicity of stakeholders. • Metrics are useful to ‘bring everyone on the same page’ and provide a commonly accepted tool to minitor progress and identify priorities. • The core ingredient behind innovation (before investment, research, and cooperation) is talent. Education is fundamental, as well as openness and appetite for change. • The GII aims at providing a set of feasible and ambitious objectives to the global community, as well as a forum where policies and strategies can be discussed, compared and coordinated.
Thank you for your attention www.globalinnovationindex.org
Key chart in the Report, on page 24 Innovation Leaders and Learners Leaders are the top 25. Learners are 18 countries out-performing their peers relative to GDP per capita: Moldova, China, India, Uganda, Armenia, Viet Nam, Malaysia, Jordan, Mongolia, Mali, Kenya, Senegal, Hungary, Georgia, Montenegro, Costa Rica, Tajikistan, and Latvia.
Some examples of fast movers Small relative changes among countries can have significant impacts on rankings. Scores are often remarkably close: for 51st to 75th positions, a span of 2.7 points; for the 76th to 100th positions, a span of 4.5 points. Uganda and Costa Rica had the most significant jumps, bringing them, incidentally, into the category of innovation learners.
Quality matters for impact Not all innovation inputs and outputs are of equal quality, and hence not all of them have the same impact. BRICs are the best performers among middle-income countries on 3 key indicators included this year (top 3 universities, patent family applications, and publications citations). The top 18 positions taken by high-income economies.
GII Advisory Board in 2013 • Khalid S. AL-SULTAN, Rector, King Fahad University for Petroleum and Minerals, Saudi Arabia • Daniele ARCHIBUGI, Research Director, Italian National Research Council; and Professor, University of London • Robert D. ATKINSON, President, The Information Technology and Innovation Foundation (ITIF), USA • Robert BELL, Program Director, National Science Foundation (NSF), USA • Irina BOKOVA, Director General, UNESCO • Dongmin CHEN, Professor/Dean, School of Innovation and Entrepreneurship, Peking University, China • Leonid GOKHBERG, First Vice-Rector, Higher School of Economics, Russian Federation • Rolf-Dieter HEUER, Director General, CERN • Raghunath Anant MASHELKAR, Bhatnagar Fellow, Council of Scientific and Industrial Research; Chairperson, National Innovation Foundation; President, Global Research Alliance, India • Diego MOLANO VEGA, Minister, Information Technologies and Communications, Colombia • Sibusiso SIBISI, President and CEO, Council for Scientific and Industrial Research, South Africa • Lynn ST. AMOUR, President and CEO, Internet Society • Rob STEELE, Secretary-General, International Organization for Standardization (ISO) • Hamadoun TOURÉ, Secretary-General, International Telecommunication Union (ITU)
Independent statistical audit Performed by the Joint Research Centre of the European Commission The general conclusionis that missing data are problematic, particularly for the output sub-index. Inclusion for the first time of a measure of distance to the efficient frontier by Data Envelopment Analysis (country-specific weights for pillars instead of common weights).
Year-on-year comparability of results(Annex 2) Change in rankings due to data updates • 2012 framework, 2012 and 2012 data compared • Missing data might affect the rankings, not just performance • The US and Singapore would have kept their 2012 rankings (10th and 3rd respectively) had we kept the 2012 framework unchanged Change in rankings due to adjustments to the GII framework • 2013 data, 2012 and 2013 frameworks compared (20 indicators with adjustments) • The US gained 5 positions and Singapore lost 5 due to adjustments to the GII framework • Focus on indicators on quality (top 3 universities score, citations of publications, patent family applications in at least three offices) Inclusion of 3 countries, exclusion of 2 (indicator coverage criteria) • This effect, important last year, is monor this year • All countries ranked 48 onwards were affected by Barbados entering the rankings at position 47