Download
1 / 20
200 likes | 333 Vues
Data Mining and Performance Comparison between various software tools. Xi, Yuting Supervised by: Dr. Marzi , Hosein Department of Information System ST. Francis Xavier U niversity. O utline Introduction Data sets Analysis of Framingham Heart Study Database

E N D
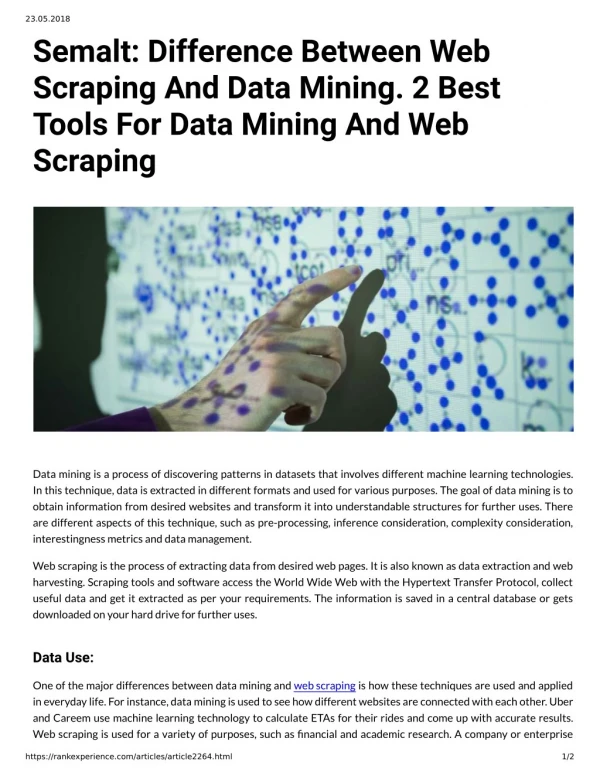
Data Mining and Performance Comparison between various software tools Xi, Yuting Supervised by: Dr. Marzi, Hosein Department of Information System ST. Francis Xavier University
Outline • Introduction • Data sets • Analysis of Framingham Heart Study Database • Analysis of CARE’s Pathways Program • Software Tools • Analysis of Framingham Heart Study Database • Analysis of CARE’s Pathways Program • Analysis of Framingham Heart Study Database • Univariate analysis • Complex Analysis • Analysis of CARE’s Pathways Program • Conclusion • Future work
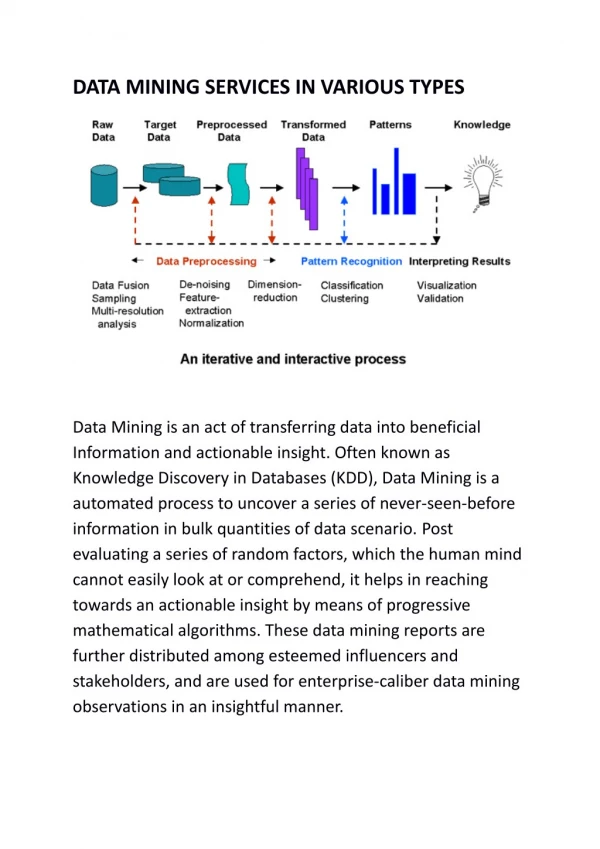
Introduction • Data mining concepts • Two approaches • Purpose
Data Sets • Analysis of Framingham Heart Study Database • The dataset includes 38 attributes over 4,434 participants and the process was taken in 3 periods in 24 years.The relationship between diabetes and the following variables: glucose, sex, smoking, BMI is researched in this case. • The following is a table of the attributes that observed.
Analysis of CARE’s Pathways Program • 2012 CARE’s Pathways Program’s objective is to assess the readiness of the group in terms of group governance/health, market-related capacities and financial services capacities, and to estimate the collectives’ suitability for pathways, whether training is needed or not to make collectives in position to meet the market standards. There are many countries have taken part in this project, the following case study uses the Tanzania dataset which includes 448 objects. • The following table is a sample record of this dataset.
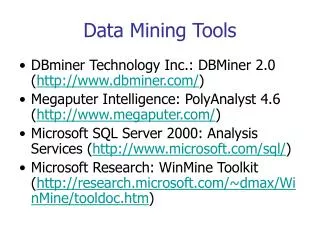
Software Tools • Analysis of Framingham Heart Study Database • The first case uses SAS which is widely used in extracting feature from large amount of data. • Analysis of CARE’s Pathways Program • The second case uses SPSS. SPSS is a software package that provided by IBM Company which is now officially named "IBM SPSS Statistics".
Analysis of Framingham Heart Study Database Univariate analysis Chi-square testfor the binary variables two-sample t-test for the continue variables
Complex Analysis The model is set up to predict the probability that a person has diabetes (DIABETES=1) with independent variables including SEX, CURSMOKE, GLUCOSE and BMI. The following table shows the test statistic (554.7707) with p-value <0.0001, so the logistic model is a significant fit to the data. The test statistic (554.7707) with p-value <0.0001
The type 3 analysis of effects table indicates that the two effects are significant that are GLUCOSE and BMI because the p-values are all <0.05. However, the effect of SEX and CURSMOKE are not significant with p-value 0.8358 and 0.0705 and should be dropped from the model.
In order to select a better model, stepwise selection method can be used to explore the best model for this study. The reduced model contains two predictors which are glucose and BMI. The predictor variable sex and smoke are dropped by the model selection. The following table shows the steps in this procedure.
Step 0: To start a stepwise procedure, Analysis of Effects Not in the Model process must be done. Step 1: Effect GLUCOSE entered. The test statistics for GLUCOSE and DIABETES is 1499.709 with p-value<0.0001 in step 0, so there are significantly different glucose between people with diabetes and without diabetes, and GLUCOSE is entered in step 1.
Step 2: Effect BMI entered. The test statistics for BMI and DIABETES is 11.0205 with p-value 0.0009 which is less than 0.05 in step 1, so there are significantly different BMI between people with diabetes and without diabetes, and BMI is entered in step 2. Since there is no additional effects met the 0.05 significance level for entry into the model, the stepwise procedure is completed. Analysis of Effects not in the Model is shown below (the left one): The Odds Ratio Estimates table indicates that the odds of having diabetes are 1.083 (1/0.923) times higher with every additional unit of glucose added. The odds of having diabetes are 1.093 (1/0.915) times higher with every additional unit of BMI added.
Analysis of CARE’s Pathways Program There are generally five types of groups in Tanzania. The following table indicates them as 1=VSLA, 2= VSLA+PG, 3=Produce Groups, 4=Enterprise Development, 5=others. 64% of the groups which involves in the project are producer groups, 15% are VSLA which is group associated with financial work, 17% are the mix of the above two types, 3% are other types and only 1% is focus on enterprise development.
The scatter plot is evidence that Female members in the collectives do not influence the overall behavior. scatter plot between female’s percentage and overall average score
For all types of groups, governance and health area is where they are strong in and they are all generally weak in marketing capacity. Overall, there are 22% of the groups which can be considered as very good for pathways, 41% of the groups can be considered as good for pathways, 29% of the groups are average and there are risks with them entering Pathways, and there are 8% of the groups may not be ready for pathways but may be with some training, particularly if weaknesses occur largely in one area.
Conclusion SAS: a representativeness of software that requires users typing code so that a serious of customized work can be done continuously. SPSS:a good example of user-friendly interface software which may be suitable for people who is new in this area.
Future Work • Prediction --- Framingham Heart Study • Prediction is not included in this work but it is worth considering. Framingham Heart Study is a long term study and has a very large data set. It is highly possible that future work can keep going with this data set, such as prediction.