Download

1 / 67
670 likes | 768 Vues
SCAG’s Model Peer Review Part II - Review of Model Data and Analysis. AM Peak Traffic Volume Difference 2025 Baseline vs 1997 - without HDV. Greater than -5% -5% - 5% Greater than 5%. Greater than -5% -5% - 5% Greater than 5%.

E N D
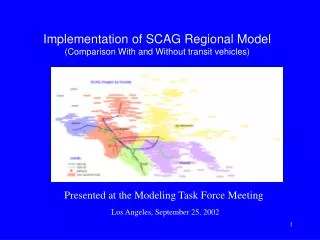
SCAG’s Model Peer ReviewPart II - Review of Model Data and Analysis
AM Peak Traffic Volume Difference2025 Baseline vs 1997 - without HDV Greater than -5% -5% - 5% Greater than 5% Greater than -5% -5% - 5% Greater than 5% Daily Traffic Volume Difference2025 Baseline vs 1997 - with HDV The Issue Some freeway links show decrease in traffic volume
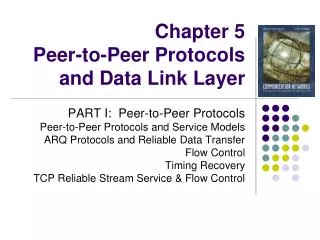
Research Approach • Alternative models to aid in understanding the nature of the issue: generic or unique to the SCAG’s model. • Sensitivity tests to identify the effects of model parameters. • Scenario analysis to examine the aggregate impacts of changes in SED and policy variables. • Corridor analysis to understand the shift of traffic pattern.
Alternative Models • SCAG RTP98 Model (old model) • MTA Regional Transportation Model • OCTA Transportation Model
Transit Trip Assignment Vehicle Trips Assignment (w/Trucks) SCAG Regional Transportation Model Input Assumptions(TDM, Auto, etc.) Socioeconomic and Landuse Data Network Level-of-Service Trip Generation Trip Distribution Mode Choice Evaluation If vmt ratio<1% or loops< 5
Growth Factors 2020 (RTP98)Person Trip Table MTA Regional Transportation Model 2001 RTP Socioeconomic Data(4-2001 Version) Network Level-of-Service Trip Generation 2020 (RTP98)P&A from generation 2025 P&A from generation ASSUMPTIONS USED AFTER GENERATION 2.4% WORK AT HOME 0.3% TELECOMMUTING 1% NON MOTORIZED TRIPS Fratar trip distribution HO=HO*0.99 OO=00*0.99 OW=0W*0.99 HS=HS*0.99 Mode Choice & Assignment HW=((HW*(1-0.024)+(HW-HW*(1-0.024))*0.003))*0.99
Transit Trip Assignment Vehicle Trip Assignment OCTA Transportation Model Input Assumptions(TDM, Auto, etc.) Socioeconomic and Landuse Data Network Level-of-Service Trip Generation Trip Distribution Mode Choice If (overall speed difference> 5%) Evaluation
Old Model 2025 vs 1997 AM Peak Traffic Volume Difference
Findings from Alternative Models Analysis The issue at hand is not unique to the current SCAG Model. When the same socioeconomic data is applied, all major models in the SCAG Region show consistent results.
RTP Model Run • 1997 Base Year • 1997 SED, 1997 SED distribution pattern • 1997 networks • 1997 assumptions (telecommuting, auto operating cost) • 2025 Baseline • 2025 SED, 2001 RTP distribution • 2025 Baseline networks • 2025 assumptions (telecommuting, auto operating cost)
Lane Miles by County and Facility Type 2025 Baseline vs 1997
RTP 2001, Year 2025 Baseline Transit Network: Changes from 1997 Base Year Network
Home-Work Person Trip Table (P-A) 1997 Home-Work 2025 Home-Work
Daily Person Trip Table (P-A) 1997 Total 2025 Total
Daily Traffic Volume Difference2025 Baseline vs 1997 - with HDV Greater than -5% -5% - 5% Greater than 5%
Daily Traffic Volume Difference2025 Baseline vs 1997 - without HDV Greater than -5% -5% - 5% Greater than 5%
Greater than -5% -5% - 5% Greater than 5% AM Peak Traffic Volume Difference2025 Baseline vs 1997 - with HDV
AM Peak Traffic Volume Difference2025 Baseline vs 1997 - without HDV Greater than -5% -5% - 5% Greater than 5%
Summary of Observations from 1997 to 2025 1. Significant change in trip pattern, especially in trips between LA and Orange County 2. Substantial drop in speeds for all facility types 3. Screenline volumes shift to arterials 4. Trip length increases in time but decreases in distance
Factors Affecting Travel Demand Model Results 1. Socioeconomic Data a.Spatial distribution of the socioeconomic data b. Internal composition of the socioeconomic data 2. Networks and Other Input Assumptions 3. Model Structure and Applications a. Market segmentation and trip generation b. Travel impedance (time, cost, logsum) c. Trip distribution model d. Mode choice model e. Assignment algorithm f. Convergence process 4. Implementation Software (Tranplan)
Sensitivity Tests In general, these sensitivity tests (50+) are executed on Home-Based Work trips with single pass all-or-nothing assignments. The reason for such a simplified approach is that it takes about 3 days to complete a SCAG model run due to the size of the model and the limitation of hardware and software.
Test Log 1 *2025 EMP proportional to 98RTP distribution **2025 SED proportional to 98RTP distribution
Test Log 2 * Modified based on 1997 Worker/Residential Pop ** Nornalized to Regional Production
Test Log 3 * Modified based on 1997 Worker/Residential Pop
Findings from Sensitivity Tests • Volume differences cannot be explained by varying parameters in trip generation model, mode choice model, and trip assignment model. • Trip distribution model has some effects. Major factors include: 1. The number of iterations on attraction (degree of attraction convergence) 2. Travel impedance measurement (SOV time or Logsum)
Scenarios Test Three different combinations of socioeconomic distribution, transportation networks, and auto travel costs are modeled to examine the aggregate impacts of changes in socioeconomic data and policy variables.Complete model runs are conducted for these tests.
Scenarios Description • TEST A • 2025 SED total, 1997 distribution pattern • 1997 network • 1997 assumptions (telecommuting, auto operating cost) • Purpose: What happens if SED is increased to 2025 levels, but all other factors remain constant? • TEST B • 2025 SED total, 1997 distribution pattern • 2025 network • 2025 assumptions (telecommuting, auto operating cost) • Purpose: Isolate impacts of growth distribution between 1997 and 2025. • TEST C • 2025 SED total, 2001 RTP distribution • 2025 network • 2025 telecommuting • 1997 auto operating cost • Purpose: Isolate the effect of auto operating cost
Daily Traffic Volume DifferenceTest A (2025) vs 1997 - with HDV Greater than -5% -5% - 5% Greater than 5%
AM Peak Traffic Volume DifferenceTest A (2025) vs 1997 - with HDV Greater than -5% -5% - 5% Greater than 5%
Daily Traffic Volume DifferenceTest A (2025) vs 1997 - without HDV Greater than -5% -5% - 5% Greater than 5%
AM Peak Traffic Volume DifferenceTest A (2025) vs 1997 - without HDV Greater than -5% -5% - 5% Greater than 5%
Daily Traffic Volume DifferenceTest B (2025) vs 1997 - with HDV Greater than -5% -5% - 5% Greater than 5%
AM Peak Traffic Volume DifferenceTest B (2025) vs 1997 - with HDV Greater than -5% -5% - 5% Greater than 5%
Daily Traffic Volume DifferenceTest B (2025) vs 1997 - without HDV Greater than -5% -5% - 5% Greater than 5%
AM Peak Traffic Volume DifferenceTest B (2025) vs 1997 - without HDV Greater than -5% -5% - 5% Greater than 5%
Daily Traffic Volume DifferenceTest C (2025) vs 1997 - with HDV Greater than -5% -5% - 5% Greater than 5%
AM Peak Traffic Volume DifferenceTest C (2025) vs 1997 - with HDV Greater than -5% -5% - 5% Greater than 5%