Download
1 / 17
170 likes | 305 Vues
CALS Sandpoint Greenhouse. Team Green Thumb Greenhouse Design Team. Caitlin Keith, Jiangong Li, Brian Lockner , Josh Miller. Background Information. Client Needs

E N D
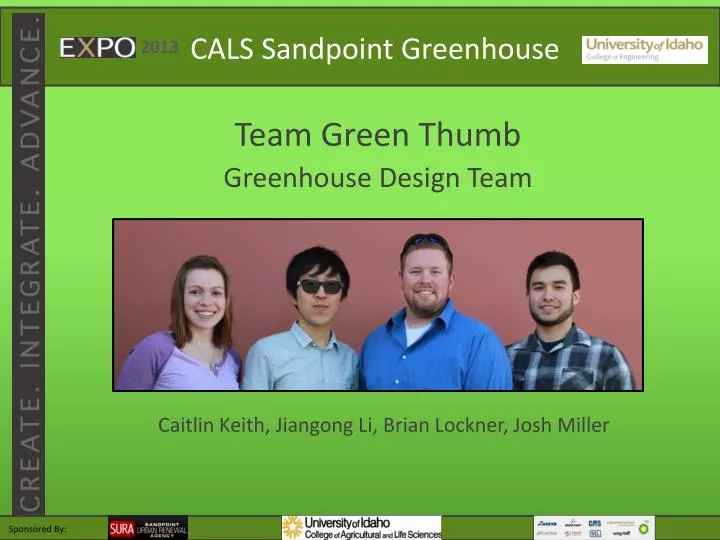
CALS Sandpoint Greenhouse Team Green Thumb Greenhouse Design Team Caitlin Keith, Jiangong Li, Brian Lockner, Josh Miller
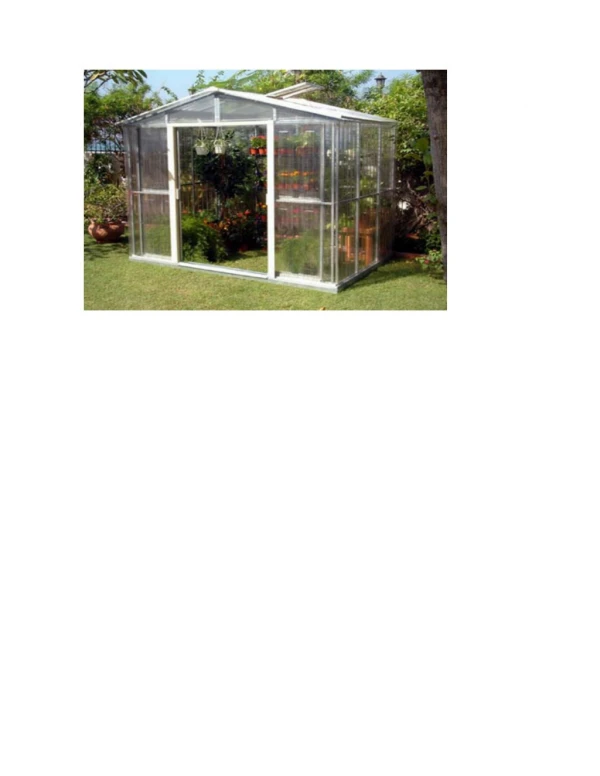
Background Information Client Needs Sandpoint Urban Renewal Agency (SURA) is investigating the feasibility of installing a commercial greenhouse that could operate year-round in Sandpoint, Idaho. Project Goals Using engineering principles, computer modeling, and modern irrigation techniques, we will design a greenhouse that can provide local and/or organic food to the city of Sandpoint.
3-Phase Feasibility Study Phase I: Estimate capital, building and operating (including energy) costs of greenhouses in the Sandpoint area. Phase II: Dependent upon the findings in step one, assess which vegetable/herb crops can be grown in the Sandpoint area. Phase III: Determine the demand for such crops at price points which would cover costs estimated in phases I and II, for sale to local consumers.
Project Flow Chart SURA Influence Project Learning Greenhouse Tours Structural Design Internal Design Phase II Influence Economic Analysis Economic Analysis Optimize Best Design Model Design
Design Alternatives Inexpensive Conventional Innovative Low Initial Cost High Capacity High Degradation Inexact Climate Control Medium Initial Cost Medium Capacity Durable Precise Climate Control High Initial Cost Low Capacity Durable Precise Climate Control
Design Selection Conventional Design is determined to be our best design
Preliminary Economic Analysis MARR = 6% Inexpensive Design Present Worth = $412,000 Innovative Design Present Worth = $275,902
Design Optimization • Irrigation Lighting HVAC • Nutrients • Total estimated yearly cost for a 4000 gallon reservoir: • $58,781.00 • Nutrients replenished every 1-2 weeks • Tomatoes require 3-5 gallons/plant/week PVC Pipe System • Trellis encourages vertical growth • 5,000 gallon reservoir • 20 foot lengths
Design Optimization • Irrigation Lighting HVAC Photosynthesis & Illumination Requirement • Average vegetable light compensation point is 2000 lx. • At 4000 lx, the efficiency of photosynthesis can reach the maximum level. • Average illumination time for common vegetable is 12 hours/day.
Design Optimization • Irrigation Lighting HVAC • Natural Gas Boiler • Evaporative Cooling • Passive Ventilation • HAF Fan Placement • Thermodynamic simulations using EES
Final Design Catia Modeling Plant Capacity: 4048 Annual Power Usage: 231, 690 kWh Annual O&M Costs: $210,406 Isometric View Exhaust Fans & Cooling Pads Hydroponic Irrigation
Modeling • CATIA Modeling Software • Ground Up Build • System Grouping • System Fitting CAD 1:48 Scale Physical Full-scale Irrigation
Modeling CAD 1:48 Scale Physical Full-scale Irrigation • Model size is 33.75 in. X 25 in. • Wooden dowels used to represent steel frame • Matte plastic acetate represents polycarbonate • Four functional zones show various design features • Color coded materials
Modeling CAD 1:48 Scale Physical Full-scale Irrigation • 1:30 slope allows for proper drainage • 6 inch PVC allows for easy, cheap construction • 1 L/min flow rate • Future researchers could look into oval pipes for even water distribution
Projected Annual Costs Electricity Maintenance $16,219 $210,406
Economic Analysis Cash Flow Diagram MARR = 6% Present Worth = $389,000.88 Revenue Calculation: 4048 plants * (56 weeks/10 week harvest period) * (5 lbs. yield/harvest) * ($5/lb) * 0.8 {accounts for waste}