Download
1 / 9
90 likes | 239 Vues
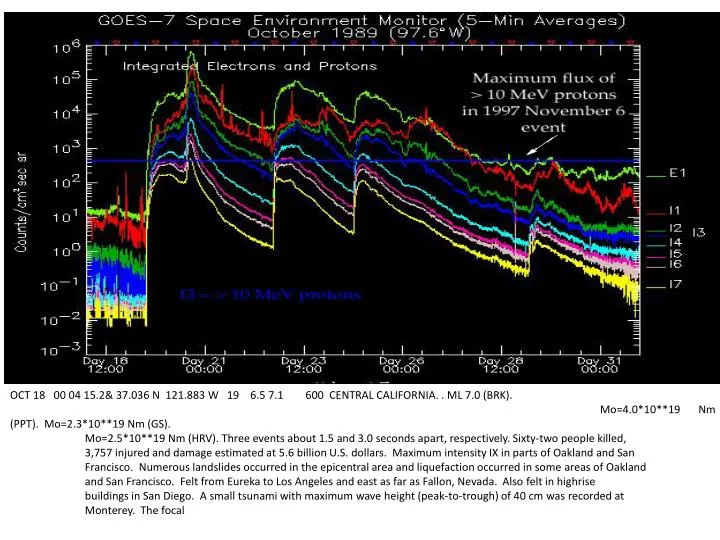
OCT 18 00 04 15.2& 37.036 N 121.883 W 19 6.5 7.1 600 CENTRAL CALIFORNIA. . ML 7.0 (BRK). Mo=4.0*10**19 Nm (PPT). Mo=2.3*10**19 Nm (GS). Mo=2.5*10**19 Nm (HRV). Three events about 1.5 and 3.0 seconds apart, respectively. Sixty-two people killed,

E N D
OCT 18 00 04 15.2& 37.036 N 121.883 W 19 6.5 7.1 600 CENTRAL CALIFORNIA. . ML 7.0 (BRK). Mo=4.0*10**19 Nm (PPT). Mo=2.3*10**19 Nm (GS). Mo=2.5*10**19 Nm (HRV). Three events about 1.5 and 3.0 seconds apart, respectively. Sixty-two people killed, 3,757 injured and damage estimated at 5.6 billion U.S. dollars. Maximum intensity IX in parts of Oakland and San Francisco. Numerous landslides occurred in the epicentral area and liquefaction occurred in some areas of Oakland and San Francisco. Felt from Eureka to Los Angeles and east as far as Fallon, Nevada. Also felt in highrise buildings in San Diego. A small tsunami with maximum wave height (peak-to-trough) of 40 cm was recorded at Monterey. The focal
LomaPrieta_17Oct1989 1989-10-17 5:04:00 PM PDT 37.037 -121.883 7.0 • Location Local time Time zone UTC offset • San Francisco (U.S.A. - California) Wednesday, October 18, 1989 at 5:05:00 PM PDT UTC-7 hours • UTC Thursday, October 19, 1989 at 00:05:00
Proton Event • Please Note: Proton fluxes are integral 5-minute averages for energies >10 MeV, given in Particle Flux Units (pfu), measured by GOES spacecraft at Geosynchronous orbit: 1 pfu = 1 p cm-2 sr-1 s-1. SESC defines the start of a proton event to be the first of 3 consecutive data points with fluxes greater than or equal to 10 pfu. The end of an event is the last time the flux was greater than or equal to 10 pfu. This definition, motivated by SESC customer needs, allows multiple proton flares and/or interplanetary shock proton increases to occur within one SESC proton event. Additional data may be necessary to more completely resolve any individual proton event. • Different detectors, onboard different GOES spacecraft, have taken the data since 1976. These proton data were processed using various algorithms. To date, no attempt has been made to cross-normalize the resulting proton fluxes. • Flare associations are given, although data about individual coronal mass ejections (CMEs), available from SOHO only since 1996, are necessary fully to characterize each event. CME information for earlier events from the SOLWIND and SMM coronagraphs will be added in the future.
FROM SPACE ENVIRONMENT SERVICES CENTER, BOULDER, COLORADO SDF NUMBER 290 JOINT USAF/NOAA REPORT OF SOLAR AND GEOPHYSICAL ACTIVITY. ISSUED 2200Z 17 OCT 1989 IA. ANALYSIS OF SOLAR ACTIVE REGIONS AND ACTIVITY FROM 16/2100Z TO 17/2100Z: SOLAR ACTIVITY WAS MODERATE. REGION 5747 (S26E29) PRODUCED THE ONLY M-CLASS FLARE OF THE PAST DAY, AN M1/1N AT 17/1853Z. THIS REGION REMAINS THE MOST COMPLEX REGION ON THE DISK. SUNSPOTS IN THIS REGION ARE DEVELOPING SLOWLY AND THE DELTA CONFIGURATION PERSISTS. IB. SOLAR ACTIVITY FORECAST: SOLAR ACTIVITY IS EXPECTED TO BE MODERATE. REGION 5747 IS EXPECTED TO PRODUCE M-CLASS FLARES, AND MAY PRODUCE AN ISOLATED X-LEVEL FLARE. IIA. GEOPHYSICAL ACTIVITY SUMMARY FROM 16/2100Z TO 17/2100Z: THE GEOMAGNETIC FIELD RANGED FROM QUIET TO ACTIVE LEVELS WITH PERIODS OF MINOR STORM CONDITIONS AT SOME HIGH LATITUDE STATIONS FROM 17/0900-1500Z. IIB. GEOPHYSICAL ACTIVITY FORECAST: THE GEOMAGNETIC FIELD IS EXPECTED TO BE MOSTLY UNSETTLED. III. EVENT PROBABILITIES 18 OCT-20 OCT CLASS M 75/75/75 CLASS X 15/15/15 PROTON 05/05/05 PCAF GREEN IV. OTTAWA 10.7 CM FLUX OBSERVED 17 OCT 224 PREDICTED 18 OCT-20 OCT 220/220/220 90 DAY MEAN 17 OCT 215 V. GEOMAGNETIC A INDICES OBSERVED AFR/AP 16 OCT 012/012 ESTIMATED AFR/AP 17 OCT 015/012 PREDICTED AFR/AP 18 OCT-20 OCT 012/010-012/012-008/010
FROM SPACE ENVIRONMENT SERVICES CENTER, BOULDER, COLORADO SDF NUMBER 291 JOINT USAF/NOAA REPORT OF SOLAR AND GEOPHYSICAL ACTIVITY. ISSUED 2200Z 18 OCT 1989 IA. ANALYSIS OF SOLAR ACTIVE REGIONS AND ACTIVITY FROM 17/2100Z TO 18/2100Z: SOLAR ACTIVITY WAS HIGH. REGION 5747 (S27E16) PRODUCED AN M7/2B FLARE AT 18/1823Z. THE MINOR DISCRETE RADIO BURSTS ACCOMPANYING THIS FLARE INCLUDED A 310 SFU TENFLARE. THIS REGION REMAINED LARGE AND MAGNETICALLY COMPLEX BOTH BEFORE AND IN THE WAKE OF THE MAJOR FLARE. REGION 5744 (S23W03) PRODUCED SEVERAL SUBFLARES WHILE THE REMAINING REGIONS WERE STABLE THROUGHOUT THE PERIOD. NO NEW REGIONS WERE ASSIGNED TODAY. IB. SOLAR ACTIVITY FORECAST: SOLAR ACTIVITY IS EXPECTED TO BE MOSTLY MODERATE. REGION 5747 APPEARS TO BE THE ONLY REGION CAPABLE OF M-CLASS ACTIVITY. THERE IS A SLIGHT CHANCE FOR AN X-CLASS FLARE FROM THIS REGION. IIA. GEOPHYSICAL ACTIVITY SUMMARY FROM 17/2100Z TO 18/2100Z: THE GEOMAGNETIC FIELD HAS BEEN AT QUIET TO ACTIVE LEVELS AT MIDDLE LATITUDES. THE HIGHER LATITUDE FIELD RANGED FROM QUIET TO MINOR STORM LEVELS. A SUDDEN IMPULSE OF 21 GAMMAS (NANOTESLAS) WAS OBSERVED AT BOULDER AT 18/0051Z. THE DISTURBANCE MAY HAVE BEEN CAUSED BY THE DISAPPEARANCE OF A 30 DEGREE FILAMENT AT 14/2327-2352Z. IIB. GEOPHYSICAL ACTIVITY FORECAST: THE GEOMAGNETIC FIELD IS EXPECTED TO BE UNSETTLED AT MIDDLE LATITUDES. THE HIGHER LATITUDE FIELD IS EXPECTED TO BE AT UNSETTLED TO ACTIVE LEVELS. NO SIGNIFICANT GEOMAGNETIC EFFECTS ARE EXPECTED IN THE WAKE OF TODAY'S MAJOR FLARE. III. EVENT PROBABILITIES 19 OCT-21 OCT CLASS M 90/90/90 CLASS X 20/20/20 PROTON 10/10/10 PCAF GREEN IV. OTTAWA 10.7 CM FLUX OBSERVED 18 OCT 226 PREDICTED 19 OCT-21 OCT 230/230/228 90 DAY MEAN 18 OCT 215 V. GEOMAGNETIC A INDICES OBSERVED AFR/AP 17 OCT 014/013 ESTIMATED AFR/AP 18 OCT 018/018 PREDICTED AFR/AP 19 OCT-21 OCT 012/020-012/015-015/018
Science of the earthquake[edit] Data on magnetic disturbancesThe Loma Prieta earthquake was preceded by disturbances in the background magnetic field strength as measured by a sensor placed in Corralitos, California, about 4.5 miles (7 km) from the epicenter.[60] From October 5, a substantial increase in background noise was measured in the frequency range 0.01–10 Hz.[60] The measurement instrument was a single-axis search-coil magnetometer that was being used for low frequency research by Antony C. Fraser-Smith of Stanford University.[60] Signals in the range .01–.5 Hz rose to exceptionally high levels about three hours before the earthquake.[60] Though this pattern gave scientists new ideas for research into potential precursors to earthquakes, more recent studies have cast doubt on the connection, attributing the observations before the Loma Prieta quake to either an unrelated and more geographically widespread magnetic disturbance[61] or to sensor malfunctions.[62]
Bibliographic Code: • 2009PEPI..173..207T • Abstract • Among the most frequently cited reports in the science of earthquake prediction is that by Fraser-Smith et al. (1990) and Bernardi et al. (1991). They found anomalous enhancement of magnetic-field noise levels prior to the 18 October 1989 Loma Prieta earthquake in the ultra-low-frequency range (0.0110-10.001 Hz) from a ground-based sensor at Corralitos, CA, just 7 km from the earthquake epicenter. In this analysis, we re-examine all of the available Corralitos data (21 months from January 1989 to October 1990) and the logbook kept during this extended operational period. We also examine 1.0-Hz (1-s) data collected from Japan, 0.0167-Hz (1-min) data collected from the Fresno, CA magnetic observatory, and the global Kp magnetic-activity index. The Japanese data are of particular importance since their acquisition rate is sufficient to allow direct comparison with the lower-frequency bands of the Corralitos data. We identify numerous problems in the Corralitos data, evident from both straightforward examination of the Corralitos data on their own and by comparison with the Japanese and Fresno data sets. The most notable problems are changes in the baseline noise levels occurring during both the reported precursory period and at other times long before and after the earthquake. We conclude that the reported anomalous magnetic noise identified by Fraser-Smith et al. and Bernardi et al. is not related to the Loma Prieta earthquake but is an artifact of sensor-system malfunction. • --------------------------------------------------------------------------------
-------------PARTICLE EVENT---------- Start Maximum Proton Flux (Day/UT) (pfu @ >10 MeV) Oct 19/1305 Oct 20/1600 40000