Download
1 / 92
960 likes | 1.49k Vues
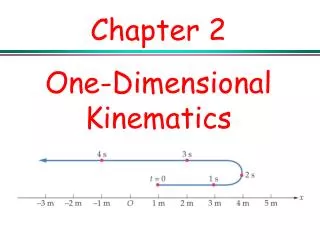
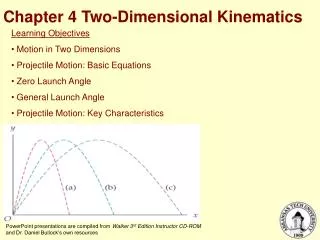
One Dimensional Kinematics - Chapter Outline. Lesson 1 : Describing Motion with Words Lesson 2 : Describing Motion with Diagrams Lesson 3 : Describing Motion with Position vs. Time Graphs Lesson 4 : Describing Motion with Velocity vs. Time Graphs

E N D
One Dimensional Kinematics - Chapter Outline Lesson 1 : Describing Motion with Words Lesson 2 : Describing Motion with Diagrams Lesson 3 : Describing Motion with Position vs. Time Graphs Lesson 4 : Describing Motion with Velocity vs. Time Graphs Lesson 5 : Free Fall and the Acceleration of Gravity Lesson 6 : Describing Motion with Equations
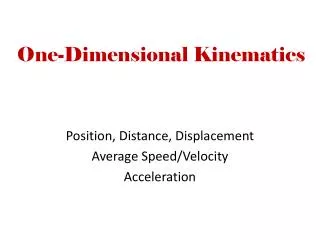
Lesson 1 : Describing Motion with Words • Introduction to the Language of Kinematics • Scalars and Vectors • Distance and Displacement • Speed and Velocity • Acceleration
Introduction to the Language of Kinematics • Mechanics - ________________________________ • Kinematics - _______________________________ ___________________________________________
Scalars and Vectors • Scalars _________________________ • Vectors _________________________
Check Your Understanding To test your understanding of this distinction, consider the following quantities listed below. Categorize each quantity as being either a vector or a scalar.
Distance and Displacement • Distance _____________________________________ • Displacement ____________________________________________. • Example: consider the motion depicted in the diagram below. A physics teacher walks 4 meters East, 2 meters South, 4 meters West, and finally 2 meters North. the physics teacher has walked a total distance of ___ meters, her displacement is ___ meters.
example • Use the diagram to determine the resulting displacement and the distance traveled by the skier during these three minutes. The skier covers a distance of ______________________________. and has a displacement of _________________________________.
example • What is the coach's resulting displacement and distance of travel? The coach covers a distance of ________. and has a displacement of _____________.
Check Your Understanding • 1. What is the displacement of the cross-country team if they begin at the school, run 10 miles and finish back at the school? • 2. What is the distance and the displacement of the race car drivers in the Indy 500?
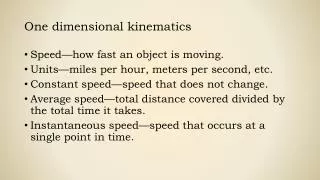
Speed and Velocity • Speed __________________________________ • Velocity __________________________________ • The direction of the velocity ___________________ _____________________________________________
Calculating Average Speed and Average Velocity • The average speed during the course of a motion is often computed using the following formula: • In contrast, the average velocity is often computed using this formula
example • While on vacation, Lisa Carr traveled a total distance of 440 miles. Her trip took 8 hours. What was her average speed?
Average Speed versus Instantaneous Speed • Instantaneous Speed - ________________________ ____________________________________________ Average Speed - _____________________________ ____________________________________________.
Average speed is a measure of the distance traveled in a given period of time; Suppose that during your trip to school, you traveled a distance of 5 miles and the trip lasted 0.2 hours (12 minutes). The average speed of your car could be determined as During your trip, there may have been times that you were stopped and other times that your speedometer was reading 50 miles per hour. Yet, on average, you were moving with a speed of 25 miles per hour.
Constant speed: __________ ________________________ ________________________ An object with a changing speed would be __________ _______________________ _______________________
example • The physics teacher walks 4 meters East, 2 meters South, 4 meters West, and finally 2 meters North. The entire motion lasted for 24 seconds. Determine the average speed and the average velocity. her average speed was ___________ and her average velocity of __________
example • Use the diagram to determine the average speed and the average velocity of the skier during these three minutes. The skier has an average speed of ____________________ and an average velocity of __________________________.
example • What is the coach's average speed and average velocity? The coach has an average speed of __________________ and an average velocity of __________________________
In conclusion • Speed and velocity are kinematics quantities that have distinctly different definitions. Speed, being a _______quantity, is the rate at which an object covers ___________. The average speed is the _____________ (a scalar quantity) per time ratio. Speed is ignorant of direction. On the other hand, velocity is a _________quantity; it is direction-aware. Velocity is the rate at which the position changes. The average velocity is the ______________ or position change (a vector quantity) per time ratio.
Acceleration • Acceleration _______________________ __________________________________
The Meaning of Constant Acceleration • constant acceleration __________________________ • _____________________________________________ • An object with a constant acceleration should not be confused with an object with a constant velocity.
Calculating the Average Acceleration a = ______ a = ______ a = ___________ the units on acceleration is ____________
Check Your Understanding • Use the equation for acceleration to determine the acceleration for the following two motions.
Lesson 2 : Describing Motion with Diagrams • Introduction to Diagrams • Ticker Tape Diagrams • Vector Diagrams
Introduction to Diagrams • The two most commonly used types of diagrams used to describe the motion of objects are: • _________________________ • _________________________
Check Your Understanding • Ticker tape diagrams are sometimes referred to as oil drop diagrams. Imagine a car with a leaky engine that drips oil at a regular rate. Describe the car’s motion characteristics during each section of the diagram. 1. ____________________________________________________________________________________ 2. ____________________________________________________________________________________ 3. ____________________________________________________________________________________
Vector diagrams are diagrams that depict the direction and relative magnitude of a vector quantity by a vector arrow.
Lesson 3 : Describing Motion with Position vs. Time Graphs • The Meaning of Shape for a p-t Graph • The Meaning of Slope for a p-t Graph • Determining the Slope on a p-t Graph
Lesson 3 - Describing Motion with Position vs. Time Graphs • The Meaning of Shape for a p-t Graph Straight line -______________________________ Curved line - __________________________________
Check Your Understanding • Use the principle of slope to describe the motion of the objects depicted by the two plots below.
The Meaning of Slope for a p-t Graph • The slope of the line on a position-time graph is __________________________________. • If the object is moving with a velocity of +4 m/s, then the slope of the line will be ______. If the object is moving with a velocity of -8 m/s, then the slope of the line will be _______. If the object has a velocity of 0 m/s, then the slope of the line will be ________.
example Describe the velocity of the object between 0-5 s and between 5-10 s.
Determining the Slope on a p-t Graph • Let's begin by considering the position versus time graph below. • Pick two points on the line and determine their coordinates. • Determine the difference in y-coordinates of these two points (rise). • Determine the difference in x-coordinates for these two points (run). • Divide the difference in y-coordinates by the difference in x-coordinates (rise/run or slope).
Check Your Understanding • Determine the velocity (i.e., slope) of the object as portrayed by the graph below.
Lesson 4 : Describing Motion with Velocity vs. Time Graphs • The Meaning of Shape for a v-t Graph • The Meaning of Slope for a v-t Graph • Relating the Shape to the Motion • Determining the Slope on a v-t Graph • Determining the Area on a v-t Graph
Lesson 4 - Describing Motion with Velocity vs. Time Graphs • The Meaning of Shape for a v-t Graph
the slope of the line on a velocity-time graph reveals useful information about the acceleration of the object. • If the acceleration is zero, then ____________________________________ • If the acceleration is positive, then ____________________________________ • If the acceleration is negative, __________________________________
how can one tell whether the object is moving in the positive direction (i.e., positive velocity) or in the negative direction (i.e., negative velocity)?
how can one tell if the object is speeding up or slowing down?
Check Your Understanding • Consider the graph at the right. The object whose motion is represented by this graph is ... (include all that are true): • moving in the positive direction. • moving with a constant velocity. • moving with a negative velocity. • slowing down. • changing directions. • speeding up. • moving with a positive acceleration. • moving with a constant acceleration.
The Meaning of Slope for a v-t Graph: the actual slope value of any straight line on a velocity-time graph is the acceleration of the object.
From 0 s to 4 s: slope = _____ ; a = _____ From 4 s to 8 s: slope = _____; a = _____
Check Your Understanding • The velocity-time graph for a two-stage rocket is shown below. Use the graph and your understanding of slope calculations to determine the acceleration of the rocket during the listed time intervals. • t = 0 - 1 second • t = 1 - 4 second • t = 4 - 12 second