Download
1 / 15
150 likes | 299 Vues
Periodicities in Photospheric Magnetic Flux. Wenbin Song National Astronomical Observatories, CAS, Beijing 100012. Outline. Data Method Result Discussion. D a t a. Two sequences of magnetic flux:.

E N D
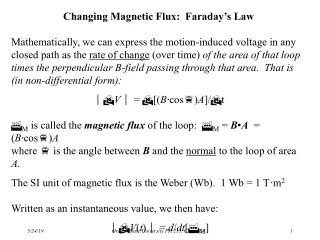
Periodicities in Photospheric Magnetic Flux Wenbin Song National Astronomical Observatories, CAS, Beijing 100012
Outline • Data • Method • Result • Discussion
D a t a Two sequences of magnetic flux: 1. Active sun: In the latitude band S60˚- N60˚ & its flux density > 25 Gauss 2. Polar region: we think that due to its flux density being within the measurement error NSO/Kitt Peak synoptic magnetic chart • 360 equal steps in the longitude & 180 equal steps in the sine latitude • line-of-sight component of flux density • Pixel areas are the same • Carrington rotations 1666 – 2007 (1978 - 2003)
1.1 How to calculate flux of active sun during one Carrington rotation? • In a synoptic chart, seek out pixels with absolute values higher than 25 Gauss and in latitude band S60˚- N60˚; • AssumeBtrue being along the vertical direction. Through projection, we have Btrue= Bobs /cos(θ),θ means the latitude; • One pixel flux: Φ = |Btrue | •s, s indicates the pixel area 4πR⊙2/(360×180); • Add up Φ values of all pixels we sought in the first step.
Flux sequence of active sun Subtract one simple sine function from the flux sequence. This sine function is obtained using the Fourier filter method and its period is about 140 rotations.
1.2 How to identify polar regions in synoptic chart? Two criteria During solar maximum, mainly according to the border of plage regions; During solar minimum, mainly according to the border of unipolar regions.
Polar area (unit: 1=full disk) In short time scale, polar areas of two hemisphere vary in opposite direction perhaps due to the movement of solar equator.
Polar area We also subtract one simple sine wave which has opposite phase to solar activity cycle.
Method 2.1 Blackman-Tukey method For any sample Sample autocovariance: Power density: If the spectrum represents a random sample, the sample spectrum estimates at a given frequency are distributed about the corresponding population spectrum according to a distribution divided by the equivalent degree of freedom. We can use this character for evaluating the significance level.
Method 2.2 Wavelet transform Morlet wavelet: Wavelet transform: Wavelet transform can yield periodicity information in time and frequency domains simultaneously.
Result 3.1 flux of active sun Five solid lines correspond to five periods obtained by B-T method. Two dashed lines depicts periods around 1.6 yr and 6.0 yr.
Result 3.2 total polar area Two solid lines correspond to two periods obtained by B-T method. Three dashed lines depicts periods around 154 d, 1.8 yr and 5.8 yr.
Discussion ~1.3- and ~2.6- yr periods occur in flux of active sun which is associated with the rotation period at the base of convective zone (1.3±0.2 yr, Howe et al., sci, 2000); Common periods: ~5.9-, ~3.4-, ~1.7-yr, ~320- and ~150-d. The 320-d and 150-d periods are the most typical ones which can be found in many other solar variabilities and activities; 3.4 yr and 1.7 yr periods might be the harmonics: 1. length (2:1); 2. evolution (in WT spectra, similar including its power amplitude and its length).
Open question: polar area during solar minimumVS flux sequence of active sun during the following solar maximum In real domain • Relative strength during cycles 22 and 23; • Two peak structure during cycle 22 In frequency domain Most periods are the same in the measurement error so that in frequency domain their correlation is good enough We think that solar activity might origin from polar regions.