Download
1 / 28
280 likes | 418 Vues
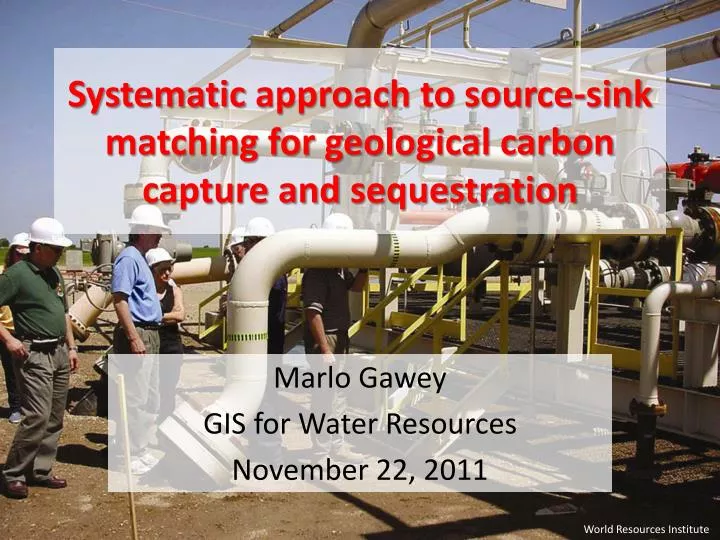
Systematic approach to source-sink matching for geological carbon capture and sequestration. Marlo Gawey GIS for Water Resources November 22, 2011. World Resources Institute. CO 2. CO 2. CO 2. CO 2. CO 2. CO 2. CO 2. CO 2. CO 2. CO 2. CO 2. CO 2. CO 2. CO 2. CO 2. CO 2. CO 2.

E N D
Systematic approach to source-sink matching for geological carbon capture and sequestration MarloGawey GIS for Water Resources November 22, 2011 World Resources Institute
CO2 CO2 CO2 CO2 CO2 CO2 CO2 CO2 CO2 CO2 CO2 CO2 CO2 CO2 CO2 CO2 CO2 http://indianapublicmedia.org Motivation
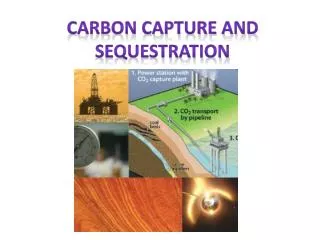
Carbon Capture & Sequestration (CCS) http://www.globalccsinstitute.com/ccs/how-ccs-works
Current Carbon Capture and Sequestration Projects http://www.globalccsinstitute.com/projects/map
Carbon Capture and Sequestration in Texas http://www.globalccsinstitute.com/projects/map
Correct pressure and temp. Porous Permeable Fluid trapping mechanism IEA Greenhouse Gas R&D Programme
Subsurface Layers of Rock to Store Fluids Biddle, K.T. and Wielchowsky, C.C., 1994, “Ch. 13: Hydrocarbon Traps,” Magoon, L.B. and W.G. Dow, eds, AAPG Memoir 60.
Major Enhanced Oil Recovery Fields in TX Data from BEG Oil Atlas courtesy of C. Breton
Sources • Ethylene plants • Hydrogen plants • Iron & steel refineries • Oil & gas refineries • Ammonia plants • Cement plants • Power plants (coal)
Major US CO2 Producers Data from USGS, IEA, TNRIS courtesy of C. Breton
Source-Sink Matching • Minimize distance from source to sink • Minimize distance to CO2 pipelines, if possible • Avoid sensitive areas • Protected aquifers • State & national parks • High density population areas http://upload.wikimedia.org
Goals • Create unique maps for qualitative source-sink matching • Use some spatial analysis to tease out prospective source-sink matches
Major TX Aquifers & Reservoirs Data from TNRIS and BEG
TX Aquifers & Protected Areas Data from BEG Oil Atlas courtesy of C. Breton
Result 296 Sources 3207 Sinks 227 Sources 2973 Sinks
… using the same method as before 25 km zone
Result 705 reservoirs 10 CO2 producers
What’s Next? Create a population density map… …And use it to screen for Sources & Sinks
Steps: • Download block shapefiles with population and housing unit counts in them http://www.census.gov/geo/www/tiger/tgrshp2010/pophu.html These polygons describe housing units Populationcount in each housing unit
3) Consolidate data HUGE data set: 914,231 polygons!
3) Using “Field Calculator” in Attribute Table, calculate population density4) Export the population density data to a new feature class and map it!