Download
1 / 9
90 likes | 177 Vues
Chr. 3. Chr. 2. cM. cM. C2_At4g14570 4.0. C2_At1g30580 0.0. C2_At1g60640 12.5. C2_At1g28530 21.0. C2_At1g78690 32.0. C2_At5g23880 53.0. C2_At1g02140 71.0. C2_At3g10220 76.9. C2_At4g21580 68.0. C2_At3g01160 83.4. C2_At3g47990 101.5.

E N D
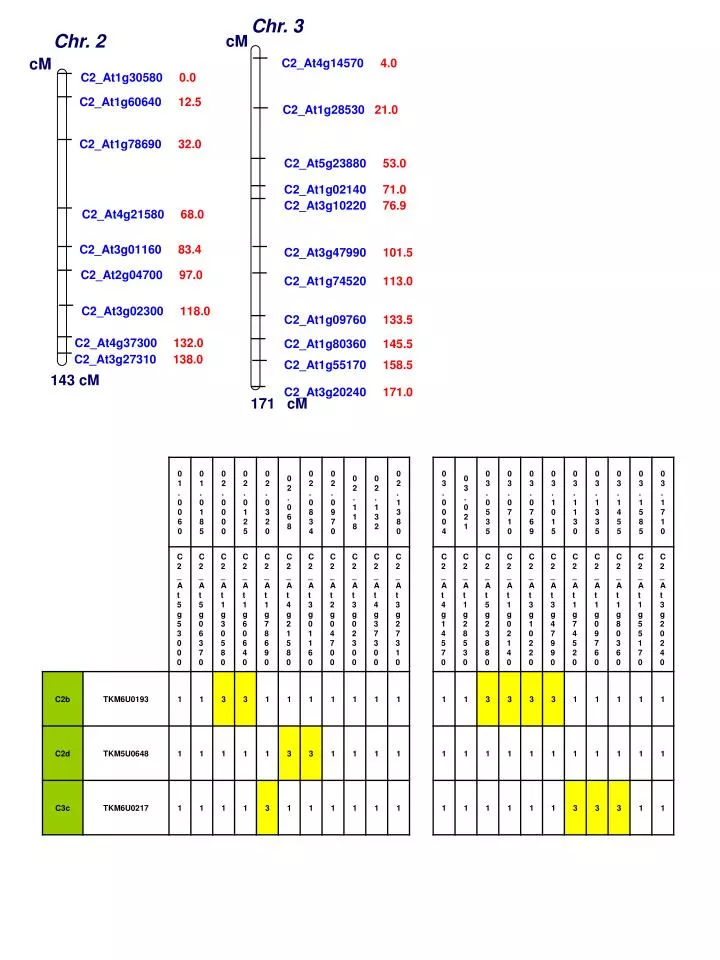
Chr. 3 Chr. 2 cM cM C2_At4g14570 4.0 C2_At1g30580 0.0 C2_At1g60640 12.5 C2_At1g28530 21.0 C2_At1g78690 32.0 C2_At5g23880 53.0 C2_At1g02140 71.0 C2_At3g10220 76.9 C2_At4g21580 68.0 C2_At3g01160 83.4 C2_At3g47990 101.5 C2_At2g04700 97.0 C2_At1g74520 113.0 C2_At3g02300 118.0 C2_At1g09760 133.5 C2_At4g37300 132.0 C2_At1g80360 145.5 C2_At3g27310 138.0 C2_At1g55170 158.5 143 cM C2_At3g20240 171.0 171 cM
Supplemental Figure S1. Marker position and genetic variability of the three previously uncharacterised introgression lines C2b, C2d and C3c. Marker positions are given on the respective chromosomes 2 and 3. The nature of the chromosomal segments between two markers is provided for all relevant regions in the Table with 3 representing homozygous for S. chmielewski whilst 1 represents homozygous for S. lycopersicum. All regions for which no information is given were homozygous for S. lycopersicum.
Supplemental Figure S2. Heat map of the metabolite profiles of the introgression lines in comparison to that of the parental control (Solanum lycopersicum cv Moneyberg) from the individual data set year 2006 under high load condition. Each square represents the effect of chromosomal segment substitution on the amount of every metabolite using false color scale. Regions of red or blue indicate that the metabolite content is increased or decreased, respectively, after the introgression of S. chmielewski LA1840 segments. For each haverst, gas chromatography-mass spectrometry was used to quantify 62 metabolites, including amino acids, organic acids, fatty acids, sugars, sugar alcohols, sugar phosphates and vitamins.
Supplemental Figure S3. Heat map of the metabolite profiles of the introgression lines in comparison to that of the parental control (Solanum lycopersicum cv Moneyberg) from the individual data set year 2007 under high load condition. Each square represents the effect of chromosomal segment substitution on the amount of every metabolite using false color scale. Regions of red or blue indicate that the metabolite content is increased or decreased, respectively, after the introgression of S. chmielewski LA1840 segments. For each haverst, gas chromatography-mass spectrometry was used to quantify 62 metabolites, including amino acids, organic acids, fatty acids, sugars, sugar alcohols, sugar phosphates and vitamins.
Supplemental Figure S4. Heat map of the metabolite profiles of the introgression lines in comparison to that of the parental control (Solanum lycopersicum cv Moneyberg) from the individual data set year 2006 under low load condition. Each square represents the effect of chromosomal segment substitution on the amount of every metabolite using false color scale. Regions of red or blue indicate that the metabolite content is increased or decreased, respectively, after the introgression of S. chmielewski LA1840 segments. For each haverst, gas chromatography-mass spectrometry was used to quantify 62 metabolites, including amino acids, organic acids, fatty acids, sugars, sugar alcohols, sugar phosphates and vitamins.
Supplemental Figure S5. Heat map of the metabolite profiles of the introgression lines in comparison to that of the parental control (Solanum lycopersicum cv Moneyberg) from the individual data set year 2007 under low load condition. Each square represents the effect of chromosomal segment substitution on the amount of every metabolite using false color scale. Regions of red or blue indicate that the metabolite content is increased or decreased, respectively, after the introgression of S. chmielewski LA1840 segments. For each haverst, gas chromatography-mass spectrometry was used to quantify 62 metabolites, including amino acids, organic acids, fatty acids, sugars, sugar alcohols, sugar phosphates and vitamins.
A B Supplemental Figure S6. Comparison of metabolic network obtained from S. chmielewskii IL population (A) with the previous reported obtained from S. pennellii IL population (B).
A B Supplemental Figure S7. Schematic representation of the metabolic changes occurring in the transition from development to ripening processes in tomato fruits of Moneyberg under high load (A) and low load (B) conditions. Data was normalize to 21 dpa. Boxes in grey and white indicate no changes and not determined, respectively.
Supplemental Figure S8. Principal component analysis of metabolite data obtained from 3 genotypes during fruit development (21, 28, 35. 42 DPA and mature stage) under two fruit load conditions (high load and low load). Green, blue and yellows represents different genotypes IL-12d, IL-9d and Moneyberg, respectively. Triangle and square represents high load and low load condtions, respectively. Different development stages of fruit were visualized by different size of symbol (increased sized of symbol indicates the later stage of fruit development).