Download
1 / 1
10 likes | 75 Vues
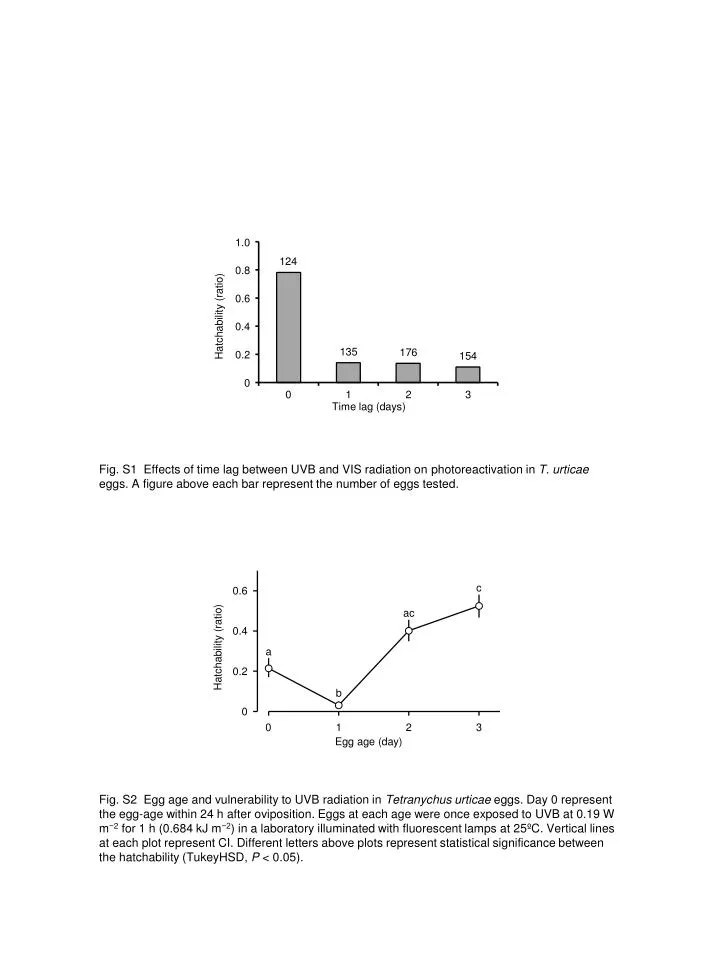
1.0. 124. 0.8. 0.6. Hatchability (ratio). 0.4. 135. 176. 0.2. 154. 0. 0. 1. 2. 3. Time lag (days). Fig. S1 Effects of time lag between UVB and VIS radiation on photoreactivation in T. urticae eggs. A figure above each bar represent the number of eggs tested. c. 0.6. ac.

E N D
1.0 124 0.8 0.6 Hatchability (ratio) 0.4 135 176 0.2 154 0 0 1 2 3 Time lag (days) Fig. S1 Effects of time lag between UVB and VIS radiation on photoreactivation in T. urticae eggs. A figure above each bar represent the number of eggs tested. c 0.6 ac 0.4 Hatchability (ratio) a 0.2 b 0 0 1 2 3 Egg age (day) Fig. S2 Egg age and vulnerability to UVB radiation in Tetranychus urticae eggs. Day 0 represent the egg-age within 24 h after oviposition. Eggs at each age were once exposed to UVB at 0.19 W m−2 for 1 h (0.684 kJ m−2) in a laboratory illuminated with fluorescent lamps at 25ºC. Vertical lines at each plot represent CI. Different letters above plots represent statistical significance between the hatchability (TukeyHSD, P < 0.05).