Download
1 / 38
380 likes | 481 Vues
The Scientific Data Management Center http://sdmcenter.lbl.gov. Arie Shoshani (PI) Lawrence Berkeley National Laboratory. Co-Principal Investigators. DOE Laboratories ANL: Rob Ross LBNL: Doron Rotem LLNL: Chandrika Kamath ORNL: Nagiza Samatova PNNL: Terence Critchlow.

E N D
The Scientific Data ManagementCenterhttp://sdmcenter.lbl.gov Arie Shoshani (PI) Lawrence Berkeley National Laboratory Co-Principal Investigators DOE Laboratories ANL: Rob Ross LBNL: Doron Rotem LLNL: Chandrika Kamath ORNL: Nagiza Samatova PNNL: Terence Critchlow Universities NCSU: Mladen Vouk NWU: Alok Choudhary UCD: Bertram Ludaescher SDSC: Ilkay Altintas UUtah: Claudio Silva XLDB meeting, Lyon, August 2009
What is SciDAC? • Department of Energy program for Scientific Discovery through Advanced Computing • Brings together physical scientists, mathematicians, computer scientists, and computational scientists • Applied to science projects in: • Nuclear Physics, • Fusion Energy, • Climate Modeling, • Combustion, • Astrophysics, • etc.
Scientific Data Management Scientific data management is a collection of methods, algorithms and software that enables efficient capturing, storing, moving, and analysis of scientific data. 6.7 Petabytes 78 million files Storage Growth 1998-2008 at NERSC-LBNL (rate: ~2X / year) 3
Problems and Goals • Why is Managing Scientific Data Important for Scientific Investigations? • Sheervolume and increasing complexityof data being collected are already interfering with the scientific investigation process • Managing the data by scientists greatlywastes scientists effective timein performing their applications work • Data I/O, storage, transfer, and archiving often conflictwith effectively using computational resources • Effectively managing, and analyzing this data and associated metadata requires a comprehensive,end-to-end approachthat encompasses all of the stages from the initial data acquisition to the final analysis of the data
A motivating SDM Scenario(dynamic monitoring) Task A: Generate Time-Steps Task B: Move TS Task D: Visualize TS Task C: Analyze TS Control Flow Layer + Flow Tier Applications & Software Tools Layer Data Mover Post Processing Parallel R Simulation Program VisIt Work Tier I/O System Layer Subset extraction File system HDF5 Libraries Parallel NetCDF PVFS SRM Storage & Network Resources Layer
Parallel Virtual File System Organization of the center:based on three-layer organization of technologies Integrated approach: • To provide a scientific workflow and dashboard capability • To support data mining and analysis tools • To accelerate storage and access to data Scientific Process Automation (SPA) Layer Workflow Management Engine (Kepler) Specialized Workflow components Scientific Dashboard Data Mining and Analysis (DMA) Layer Efficient Data Analysis and Feature Identification Parallel R indexing Statistical (Bitmap Analysis Index) Storage Efficient Access (SEA) Layer Storage Resource Manager (SRM) Adaptable I/O System (ADIOS) Parallel Active Storage Parallel I/O (ROMIO) NetCDF Hardware, Operating Systems, and Storage Systems
Focus of SDM center • high performance • fast, scalable • Parallel I/O, parallel file systems • Indexing, data movement • Usability and effectiveness • Easy-to-use tools and interfaces • Use of workflow, dashboards • end-to-end use (data and metadata) • Enabling data understanding • Parallelize analysis tools • Streamline use of analysis tools • Real-time data search tools • Sustainability • robustness • Productize software • work with vendors, computing centers • Establish dialog with scientists • partner with scientists, • education (students, scientists)
Results High Performance Technologies Usability and effectiveness Enabling Data Understanding
P0 P1 P2 P3 P0 P1 P2 P3 Parallel netCDF netCDF Parallel File System Parallel File System Speeding data transfer with PnetCDF Inter-process communication Enables high performance parallel I/O to netCDF data sets Achieves up to 10-fold performance improvement over HDF5 Early performance testing showed PnetCDF outperformed HDF5 for some critical access patterns. The HDF5 team has responded by improving their code for these patterns, and now these teams actively collaborate to better understand application needs and system characteristics, leading to I/O performance gains in both libraries. Illustration: A. Tovey Contacts: Rob Ross, ANL, Alok Choudhari, NWU
Visualizing and Tuning I/O Access This view shows the entire 28 Gbyte dataset as a 2D array of blocks, for three separate runs. Renderer is visualizing one variable out of five. Red blocks were accessed. Access times in parenthesis. Original Pattern MPI-IO Tuning PnetCDF Enhancements Data is stored in the netCDF “record” format, where variables are interleaved in file (36.0 sec). Adjusting MPI-IO parameters (right) resulted in significant I/O reduction (18.9 sec). New PnetCDF large variable support stores data contiguously(13.1 sec).
Searching Problems in Data Intensive Sciences • Find the HEP collision events with the most distinct signature of Quark Gluon Plasma • Find the ignition kernels in a combustion simulation • Track a layer of exploding supernova These are not typical database searches: • Large high-dimensionaldata sets (1000 time steps X 1000 X 1000 X 1000 cells X 100 variables) • No modification of individual records during queries, i.e.,append-only data • M-Dim queries: 500 < Temp < 1000 && CH3 > 10-4 && … • Large answers (hit thousands or millions of records) • Seek collective features such as regions of interest, histograms, etc. • Other application domains: • real-time analysis of network intrusion attacks • fast tracking of combustion flame fronts over time • accelerating molecular docking in biology applications • query-driven visualization
FastBit: accelerating analysis of very large datasets • Most data analysis algorithm cannot handle a whole dataset • Therefore, most data analysis tasks are performed on a subset of the data • Need: very fast indexing for real-time analysis • FastBit is an extremely efficient compressed bitmap indexing technology • Indexes and stores each column separately • Uses a compute-friendlycompression techniques (patent 2006) • Improves search speed by 10x – 100x than best known bitmap indexing methods • Excels for high-dimensional data • Can search billion data values in seconds • Size: FastBit indexes are modest in size compared to well-known database indexes • On average about 1/3 of data volume compared to 3-4 times in common indexes (e.g. B-trees)
Finding & tracking of combustion flame fronts Flame Front Tracking with FastBit Flame front identification can be specified as a query, efficiently executed for multiple timesteps with FastBit. Cell identification Identify all cells that satisfy user specified conditions: “600 < Temperature < 700 AND HO2concentr. > 10-7” Region growing Connect neighboring cells into regions Region tracking Track the evolution of the features through time
3D Analysis Examples Selecting particles using parallel coordinate display Trace selected particles
Query-Driven Visualization Collaboration between SDM and VIS centers Use FastBit indexes to efficiently select the most interesting data for visualization Above example: laser wakefield accelerator simulation VORPAL produces 2D and 3D simulations of particles in laser wakefield Finding and tracking particles with large momentum is key to design the accelerator Brute-force algorithm isquadratic(taking 5 minutes on 0.5 mil particles), FastBit time is linear in the number of results (takes 0.3 s, 1000 X speedup)
Results High Performance Technologies Usability and effectiveness Enabling Data Understanding
Easy to use • Dashboard front-end • Dynamic monitoring • Parallel processing • Robustness • Configurability Workflow automation requirements in Fusion Center for Plasma Edge Simulation (CPES) project • Automate the monitoring pipeline • transfer of simulation output to remote machine • execution of conversion routines, • image creation, data archiving • and the code coupling pipeline • Run simulation on a large supercomputer • check linear stability on another machine • Re-run simulation if needed • Requirements for Petascale computing Contact: Scott Klasky, et. al, ORNL
The Kepler Workflow Engine • Kepler is a workflow execution system based on Ptolemy (open source from UCB) • SDM center work is in the development of components for scientific applications (called actors)
Real-time visualization and analysis capabilities on dashboard visualize and compare shots
Storage Resource Managers (SRMs):Middleware for storage interoperability and data movement
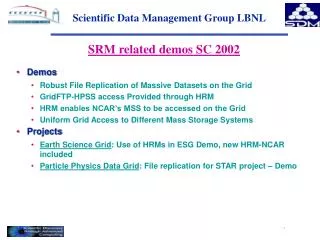
SRM use in Earth Science Grid 14000 users 170 TBs LBNL HPSS High Performance Storage System disk ANL CAS Community Authorization Services NCAR HRM Storage Resource Management gridFTP Striped server gridFTP server openDAPg server Tomcat servlet engine MyProxy server LLNL disk MCS client MyProxy client CAS client DRM Storage Resource Management RLS client DRM Storage Resource Management gridFTP server GRAM gatekeeper ORNL gridFTP server gridFTP HRM Storage Resource Management ISI gridFTP gridFTP server HRM Storage Resource Management MCS Metadata Cataloguing Services SOAP HPSS High Performance Storage System RLS Replica Location Services RMI MSS Mass Storage System disk disk SDM Contact: A. Sim, A. Shoshani, LBNL
Control Plane (light data flows) Kepler Provenance, Tracking & Meta-Data (DBs and Portals) Execution Plane (“Heavy Lifting” Computations and data flows) Capturing Provenance in Workflow Framework • Process provenance • the steps performed in the workflow, the progress through the workflow control flow, etc. • Data provenance • history and lineage of each data item associated with the actual simulation (inputs, outputs, intermediate states, etc.) • Workflow provenance • history of the workflow evolution and structure • System provenance • Machine and environment information • compilation history of the codes • information about the libraries • source code • run-time environment settings SDM Contact: Mladen Vouk, NCSU
Auth FIESTA: Framework for Integrated End-to-end SDM Technologies and Applications Storage Trust Supercomputers + Analytics Nodes Kepler Data Store Access Rec API Disp API Dashboard Management API Orchestration Provenance is captured in a data storeand used by dashboard
Dashboard uses provenance for finding location of files and automatic download with SRM Download window
Dashboard is used for job launching and real-time machine monitoring • Allow for secure logins with OTP. • Allow for job submission. • Allow for killing jobs. • Search old jobs. • See collaborators jobs.
Results High Performance Technologies Usability and effectiveness Enabling Data Understanding
Raw Data Target Data Preprocessed Data Transformed Data Patterns Knowledge Data Preprocessing Pattern Recognition Interpreting Results De-noising Object - identification Feature- extraction Normalization Dimension- reduction Data Fusion Sampling Multi-resolution analysis Classification Clustering Regression Visualization Validation An iterative and interactive process Scientific data understanding:from Terabytes to a Megabytes • Goal: solving the problem of data overload • Use scientific data mining techniques to analyze data from various SciDAC applications • Techniques borrowed from image and video processing, machine learning, statistics, pattern recognition, …
Separating signals in climate data • We used independent component analysis to separate El Niño and volcano signals in climate simulations • Showed that the technique can be used to enable better comparisons of simulations Collaboration with Ben Santer (LLNL)
Tracking blobs in fusion plasma • Using image and video processing techniques to identify and track blobs in experimental data from NSTX to validate and refine theories of edge turbulence t t+1 t+2 Denoised original After removal of background Detection of blobs Collaboration with S. Zweben, R. Maqueda, and D. Stotler (PPPL)
Task Parallelism Data Parallelism • Goal: Parallel R (pR) aims: • to automatically detect and execute task-parallel analyses; • to easily plug-in data-parallelMPI-based C/Fortran codes • to retain high-level of interactivity, productivity and abstraction Task & Data Parallelism in pR Data-parallel analyses: Task-parallel analyses: • Likelihood Maximization • Re-sampling schemes: Bootstrap, Jackknife • Markov Chain Monte Carlo (MCMC) • Animations • k-means clustering • Principal Component Analysis • Hierarchical clustering • Distance matrix, histogram, etc. Task and Data Parallelism in pR
J. of Proteome Research Vol. 5, No. 11, 2006 ProRata use in OBER Projects DOE OBER Projects Using ProRata: • Jill Banfield, Bob Hettich: Acid Mine Drainage • Michelle Buchanan: CMCS Center • Steve Brown, Jonathan Mielenz: BESC BioEnergy • Carol Harwood, Bob Hettich: MCP R. palustris >1,000 downloads
SDM center collaborationwith applications problem identified currently in progress interest expressed
Future Vision for Extreme Scale Data: Data-Side Analysis Facility • It is becoming impractical to move large parts of simulation data to end user facilities • “Near data” could be a high capacity wide-area network (100 Gbps) • On-the-fly processing capabilities – as data is generated • Data-side analysis facility (exascale workshops) • Have an analysis cluster near the data generation site • Have parallel analysis and visualization tools available on facility • Have workflow tools to compose “analysis pipelines” by users • Reuse previously composed pipelines • Package specialized components (e.g. Poincare plot analysis) • Use dynamically or as post-processing • Invoke as part of end-to-end framework • Use provenance store to track results
Implications to XLDB • Fast I/O is very important to scientists • Take advantage of append-only data for fast indexes • Workflow (pipeline) processing extremely useful • Integrated end-to-end capabilities can be very useful to get scientist’s interest (saves them time, one stop capability) • Real-time monitoring and visualization highly desirable • Data-side analysis facility may be required to be practical adjunct / alternative to UDFs
Scientific Process Management Data Analysis, Integration, and Visualization Methods Data Transfer and Scheduling Specialized Database Systems and Retrieval Techniques Storage Technology and Efficient Storage Access • SDM Book – October 2009 • New book edited and chapters written by group members • Scientific Data Management: Challenges, Technology, and Deployment, • Chapman & Hall/CRC Section 1: Berkeley Lab Mission SUBTITLE HERE IF NECESSARY Table-of-contents
Table-of-Contents • I Storage Technology and Efficient Storage Access • 1 Storage Technology, lead author: John Shalf • 2 Parallel Data Storage and Access, lead author: Rob Ross • 3 Dynamic Storage Management, lead author: Arie Shoshani • II Data Transfer and Scheduling • 4 Coordination of Access to Large-Scale Datasets in Distributed Environments, lead author: Tevfik Kosar • 5 High-Throughput Data Movement, lead author: Scott Klasky • III Specialized Retrieval Techniques and Database Systems • 6 Accelerating Queries on Very Large Datasets, lead author: Ekow Otoo • 7 Emerging Database Systems in Support of Scientific Data, lead author: Per Svensson • IV Data Analysis, Integration, and Visualization Methods • 8 Scientific Data Analysis lead author: Chandrika Kamath • 9 Scientific Data Management Challenges in High-Performance Visual Data Analysis, • lead author: E. Wes Bethel • 10 Interoperability and Data Integration in the Geosciences, lead author: Michael Gertz • 11 Analyzing Data Streams in Scientific Applications, lead author: Tore Risch • V Scientific Process Management • 12 Metadata and Provenance Management, lead author: Ewa Deelman • 13 Scientific Process Automation and Workflow Management, lead author: Bertram Ludascher