Download
1 / 21
210 likes | 407 Vues
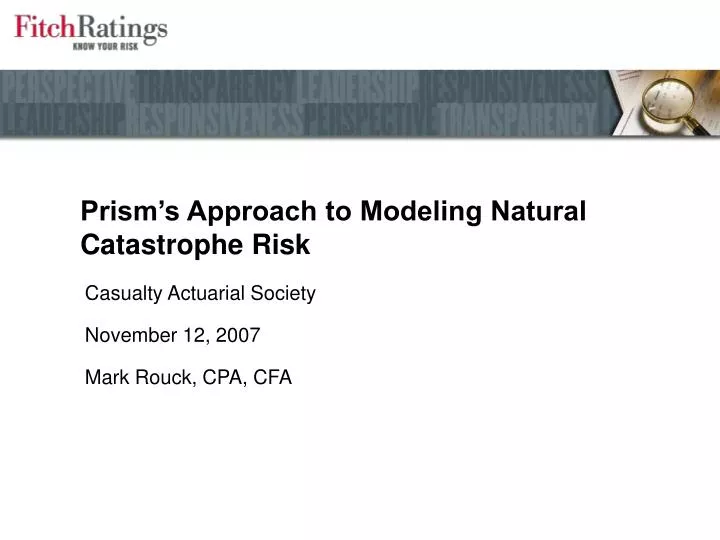
Prism’s Approach to Modeling Natural Catastrophe Risk. Casualty Actuarial Society November 12, 2007 Mark Rouck, CPA, CFA. Topics. Background on Prism . Prism’s Catastrophe Risk Component. What Does it Mean for Ratings? . Topics. Background on Prism. Prism’s Catastrophe Risk Component.

E N D
Prism’s Approach to Modeling Natural Catastrophe Risk Casualty Actuarial Society November 12, 2007 Mark Rouck, CPA, CFA
Topics Background on Prism Prism’s Catastrophe Risk Component What Does it Mean for Ratings?
Topics Background on Prism Prism’s Catastrophe Risk Component What Does it Mean for Ratings?
Nov-2007 Fully Implemented with “cure” period Late 06-Early 07 2nd QUARTER, 2006 PRIOR TO 2006 The Road to Implementation US: November 2007 Prism • A robust, global, stochastic model for evaluating the capital adequacy of insurers • Represents a significant step forward from existing regulatory and rating agency methodologies • Beta Models tested and calibrated • Executive Summary of Methodology • Technical Document of Prism • Assessment of Insurer In-house Economic Capital Models • Defining Available Capital • Calibration to Rating Thresholds • Enterprise Risk Management • Commits to building a Global Economic Capital Model (September 2004) • Releases Variable Annuities Capital Model (August 2005) • Publishes Catastrophic Risk and Capital Requirements (November 2005) and New Catastrophe Risk Analysis Increases Capital Needs by 10%. (May 2006)
Prism’s Unique Strengths and Features • Global yet local • Current list of countries: FR, GER, UK, US • Consistent assumptions and structure allows us to bolt on others • Recognizes country specific products and parameters • Integrated • Risks are modeled simultaneously – captures both diversification and compounding effects • Economic Scenario Generator / Correlated Random Numbers • Stochastic • 5,000 simulation scenarios • T-VaR approach considers “tail” events • Calibration based on historical default rates • Wave of the future – Solvency 2
Credit Risk • Incorporates defaults, migration and spread volatility • Use common market indices to establish parameters for asset type and quality • Over 50 asset buckets. • Stochastically model reinsurer default risk • Underwriting Risk • Use a collective risk model of frequency and severity of losses. • Relies on ELR, Attachments, Limits • Factors one year of new business. • Reserve Risk • Incorporates reserve adequacy analysis • Use Mack Method to Estimate Volatility • Utilize several checks to ensure data integrity • Asbestos & Environmental Losses Evaluated Separately • Catastrophe Risk • Use Company Provided PMLs • Use AIR (Catrader) software. • Consideration of up to 1 in 10,000 event • ALM (Market) Risk • Incorporates risk-free yield curve (bonds, mortgages), real estate and equity returns (DAX, FTSE, CAC). • Use a proprietary, integrated scenario generator. “Aggregator” • Consistent economic scenario set • Similar Cat event set • Correlated random numbers Each Company will potentially have unique risk curves Modeling Methods – Risk Elements Captured
Two Core Outputs Determine Prism Scores • Available Capital or “AC” • Economic, not accounting based number • What is amount of liquid capital in a controlled run-off situation • Required Capital or “RC” • Distribution table produced by the simulation • RC is not a single number but a range of outcomes • Derived by applying the appropriate T-VaR against distribution Simulation calculates PV of cash inflows and outflows over 30 year balance sheet run-off (with one year of new business) • Cash outflows: claims and expenses • Cash inflows: investment earnings and premiums on new business Prism Score is point where AC intersects RC • The highest rating level at which that occurs is your Prism Score
Capital “Score” Required vs. Available Defined by Balance Sheet Assessment Defined by Model Results
Confirmed overall existing capital assessment of Fitch universe Limited (~10% of group’s reviewed) Prism related rating actions Certain sectors performed better than expected e.g. personal auto Prism: 2006 US Non-Life Results
Topics Background on Prism Prism’s Catastrophe Risk Component What Does it Mean for Ratings?
Prism’s Catastrophe Risk Component • Insurer provided modeled annual aggregate catastrophe losses at various return periods • Frequency / Severity Assumptions = Near-term • Demand Surge = Occurrence base • AIR Catrader models gross annual aggregate catastrophe losses at various return periods based on by state premium distribution and AIR event sets • Interpolation generates modeled annual aggregate gross loss distribution ranging from 20-10K year return periods
Prism’s Catastrophe Risk Component (cont.) • Catastrophe reinsurance program applied against gross losses to create annual aggregate modeled net loss distribution • Alternatively will use insurers full net annual aggregate catastrophe loss distribution if provided • Alternatives to traditional reinsurance (i.e. catastrophe bonds, ILWs) added to catastrophe reinsurance program based on perils and attachment points
Prism’s Catastrophe Risk Component (cont.) • Modeled net catastrophe losses combined with other risk components to determine each scenario’s additional capital needs
Topics Background on Prism Prism’s Catastrophe Risk Component What Does it Mean for Ratings?
What Does this Mean for Ratings? • Capital required to support catastrophe risk varies by company and rating category • Fitch does not have single by rating category catastrophe exposure related capital requirements
What Does this Mean for Ratings? (continued) • Catastrophe related “stress test” implicitly considered through • Use of annual aggregate modeled catastrophe losses • T-VaR approach applied to overall required capital distribution • In unique cases, modeled catastrophe results can also be stressed by shifting company supplied or CATRADER generated loss distributions upward
Catastrophe Findings from 2005 Beta Testing • Insurers with large homeowners or coastal property coverages have tremendous capital exposure to extreme tail events • For these insurers required capital can materially exceed 100 year and 250 year PML used in factor based models • Others such as specialty liability underwriters have virtually no catastrophe exposure • For universe in aggregate, catastrophe related required capital was equal to 8.9% of aggregate exposure • Ignoring insurers without catastrophe exposure, range of required catastrophe capital / exposure was 6% - 37%
Takeaways • Fitch uses Prism to determine capital requirements for natural catastrophe risk • Prism considers modeled annual aggregate catastrophe loss distributions rather than select points along the distribution to develop capital requirements • Capital required to support catastrophe risk varies by insurer and by rating category • “Stress Tests” implicitly considered through annual aggregate and T-VaR approaches employed by Prism
Dedicated Website: www.fitchratings.com/prism Access to this portion of our website is free – requires only a registration.

![Data Modeling [Comparison of data modeling techniques ]](https://cdn0.slideserve.com/205866/data-modeling-comparison-of-data-modeling-techniques-dt.jpg)