Download
1 / 32
320 likes | 413 Vues
RBC Capital Markets Energy Conference June 2, 2008. Strong Experience – Focused Growth – Managing Risk. Forward-Looking Statements. This presentation contains forward-looking statements. Forward-looking statements are based on management assumptions and analyses.

E N D
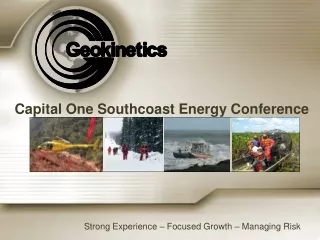
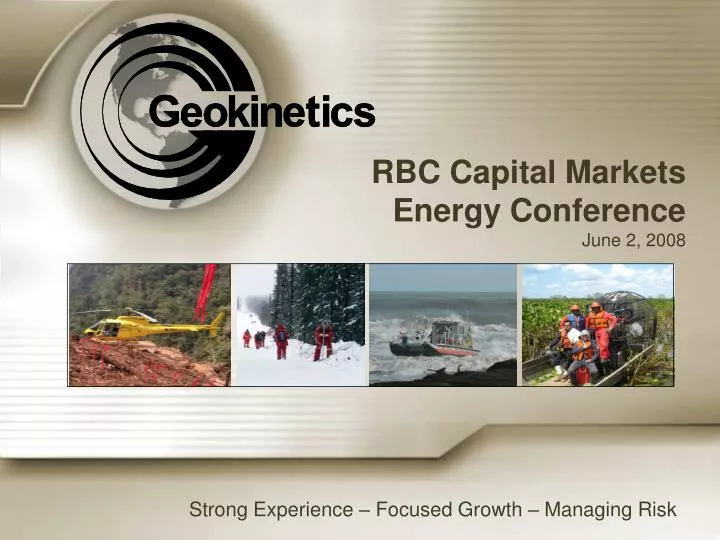
RBC Capital Markets Energy ConferenceJune 2, 2008 Strong Experience – Focused Growth – Managing Risk
Forward-Looking Statements • This presentation contains forward-looking statements. • Forward-looking statements are based on management assumptions and analyses. • Actual experience may differ and such differences may be material. • Backlog consists of written orders and estimates for our services which we believe to be firm. In many instances contracts are cancelable by customers so we may never realize some or all of our backlog, which may lead to lower than expected financial performance. • Forward-looking statements are subject to uncertainties and risks which are disclosed in Geokinetics’ Annual Report on Form 10-K.
About Geokinetics • A Global Geophysical Contractor for Customer-Driven Seismic Services in Tough Environments & Frontier Zones • Market Data (at 5/28/2008) • Exchange/Ticker: AMEX/GOK • Market Capitalization: $199.3MM • Enterprise Value $329.7MM* • Trading Data (at 5/28/2008) • Common Shares Out. 10.3 MM • Average Volume 32,941 shares/day • Institutional Ownership 54% • Key Financial Data (at 3/31/2008) • Cash $23.8MM • Debt $92.0MM • Debt to Total Cap 31.9% * Debt, Preferred Equity and Cash as of 3/31/08
Explore Develop Exploit E&P Project Cycle Seismic Data Acquisition and Processing Needed at All Stages of the E&P Cycle • Increase drilling success rates • Reduce finding and development costs “With 3-D seismic, we can understand the detailed geology much better than before. And that translates to opportunities to drill new wells to bolster production in mature fields.”- ExxonMobil, The Lamp (2007 – Number 4)
Seismic Industry Structure DataProcessing and Interpretation Data Acquisition (Contractors) WesternGeco (Schlumberger); CGGVeritas; Petroleum Geo-Services; BGP; Geokinetics; Dawson; Tidelands; and many more Equipment Providers Sercel (CGV); ION Geophysical; OYO Geospace; Mitcham; Bolt Technologies
Robust Industry Fundamentals • Seismic crew activity has grown steadily in land and increased rapidly in the marine streamer market in response to commodity prices, but still lags increase in drilling rigs • International plays (NOCs) are a key driver for seismic growth • Pressure for continued growth in activity, even at lower commodity prices • Seismic crew count in the U.S. is still less than the lowest levels in the 1990s when oil prices were near $20 per barrel • Increasing demand for seabed seismic data acquisition(Transition Zone, Ocean Bottom Cable and 4D) • Oil companies reloading prospect inventories • Resource plays are big drivers • Technical advances drive activity and create barriers to entry • Recent trend for more specialized crews and equipment • Fundamentals are strong, but we are continually monitoring for any trend toward overcapacity
Grow Customer Base & Expand into New Markets Strengthen Complementary Service Offerings Pursue Strategic Acquisitions / Alliances As Appropriate Growth Strategy Continue to Leverage Competitive Advantage • Leverage competitive advantage and expertise in difficult land environments and offshore shallow water zones to maximize profitability. Capture New Market Opportunities • Leverage operational expertise to pursue opportunities in complementary markets such as OBC • Presence in 18 of 194 countries worldwide. Further expand geographic presence and services offered. • Better assist customers with full range of seismic services, from acquisition and processing to interpretation and management. • Continue to monitor opportunities for prudent expansion.
Operational Experience & Focus Strong Experience – Focused Growth – Managing Risk
Elements of Transition Zone To Level Ground From Deepwater 150 feet Up the Escarpment To Shallow
Typical Transition Zones Surf Zone – New Zealand Inter Tidal Zone - India
Shallow Water – Transition Zones, Lakes, Swamps and Offshore • Purpose-built vessels designed for cost-effective mobilization by air, land or sea • Up to 65’ in length, ultra shallow draft vessels • Fit into four 40’ containers • Capable of operating 150 ft. water depth
Launch of OBC operations using first Sercel SeaRay system Expands offshore capabilities to 500 ft. water depth Currently using on extensive OBC projects on Australia’s N. W. Shelf Expanding OBC capabilities near-term Enhancing operating efficiency Expanding operations Second SeaRay system on order Capture additional OBC projects Ocean Bottom Cable (OBC) – Capitalizing on Opportunities
Land Operations Areas of Expertise and Opportunity • Mountainous jungle environments • High channel count crews • State-of-the-art domestic operations • Arctic environments • Socially and/or environmentally sensitive areas
Processing & Interpretation Capabilities • Full suite of onshore and offshore proprietary seismic data processing services and interpretation products • Geophysical processing • Interpretation / well log analysis (existing database) • Software • Consulting Services • Advanced Technologies for processing new data and reprocessing old data with new methods • AVO, pre-stack time and depth imaging • Multi-component and 4D • Global Reach • Offices in US and UK • P&I services stretch to all regions of the globe • Complements data acquisition services • GROWTH OPPORTUNITY for follow on work; currently less than 5%
Processing & Interpretation Strategy • Reorganization complete – benefits being realized • Complement acquisition, both in onshore and in offshore shallow water environments • Enhance multi-component processing capabilities • Enhance 4D processing techniques • Improve profitability through direct awards • Recent success with new clients
North American Operations - Canada • Operated five land crews during Canadian winter (1Q ‘08) • Three ION Vectorseis crews, two Sercel 428/408 crews • Leader in proprietary multi-component data acquisition • Sercel equipment to move internationally for Summer
North American Operations – United States • Operate up to 8 land crews all year • ION RSR, Sercel 428 / 408 and Aram Aries • Experience throughout U.S. • Competitive advantage in TX & LA swamp/marsh regions • Processing center in Houston, Texas
International Operations – Latin America • Operate up to 6 land crews all year • Sercel 428 / 408 and Aram Aries • Near-term operations in Bolivia, Brazil and Colombia • Market leader in Colombia with 19 years continuous presence • 40 years experience in Brazil with continuous presence since 2000
International Operations – Eastern Hemisphere • Operate up to 3 land crews, 3 transition zone crews and 1 OBC crew • Sercel SeaRay, Aram Aries, Sercel 408 • Near-term operations in Australia, New Zealand, Bangladesh, Egypt, Tanzania and Mozambique • Market leader in transition zone • Sole provider of Sercel SeaRay • Processing center in London (Woking), England
Financial Strength Strong Experience – Focused Growth – Managing Risk
Capitalization Capitalization as of March 31, 2008 (1) Includes $1.4 million of restricted cash at 3/31/08 and 12/31/07
YTD Financial Results • 2006 Pro Forma Results • Grant had revenue of $104.2 million and Adjusted EBITDA of $14.8 million for period ended 9/8/06 • Implies full year 2006 revenue of $329.4 million and Adjusted EBITDA of $38.0 million • FY ’07 vs. FY ‘06 combined revenue growth of 9% and Adjusted EBITDA decline of 10% Comparative Actual Financial Results ($ thousands expect per share and operating data) 1Q Revenues up 8% year-over-year; driven by Capital Investment Program
Pro Forma By Quarter • Seasonality is prevalent in operations • Results from a variety of factors including Canadian working season in 1Q and thaw in 2Q, and the budgeting cycle of international companies • 2Q07 impacted primarily by severe weather in the U.S. and a job being declared force majeure • Quarterly volatility reflects varying crew profitability due to fluctuations in size, job, location, utilization of crews and the timing of crew moves Quarterly Pro Forma Adjusted EBITDA Quarterly Pro Forma Revenue ($ in millions) ($ in millions) Note: Adjusted EBITDA reflects $727k of Grant’s Abandoned IPO expenses and $12.9 million of expenses related to the Grant Acquisition consisting primarily of investment advisor and professional fees, payout under phantom stock plan and completion bonuses which are added back in 3Q06 as well as $3.2 million of one-time severance costs in 3Q07.
Investing for Growth • Invested $95 million in 2007: • New state-of-the-art equipment (67% received in second half of year) • Expanded recording capacity • Entered OBC market • Upgraded US crews • 2008 capital expenditure budget of $65 million*, $26 million invested in 1Q ‘08 • 118,000 channels at 3/31/08 vs. 94,000 channels at 3/31/07, a 20% increase • Maintenance CAPEX averages 3% to 4% of revenues • Capital investment decisions are based on an average expected payback of less than three years EBITDA Sercel SeaRay *Subject to amendment to loan covenants
Near-Term Growth Quarterly record seismic data acquisition and data processing backlog of $417 million as of March 31, 2008 Substantial amount of 2008 covered by current backlog, remainder to be completed in 2009 and 2010 Backlog Trend 417 411* 381* 321 311 283 *Includes a $59 million job in Argentina which has been removed from current backlog due to continued delays and uncertainty.
2008 Value Drivers • Reap benefit of US Crew Upgrades Completed in 1Q ‘08 • Increased Recording Capacity Driving Revenue Growth • New Operations in Angola, Bolivia, Mozambique and Tanzania • Expand TZ / OBC Capacity • Positive Earnings from Processing & Interpretation
Why Buy GOK? • Record backlog provides visible growth through 2008 and into 2009 • Leader in high-value transition zone/OBC niche • Improving data acquisition operating margins • Integration of acquired companies substantially complete • Recent investments of $121 MM in new revenue-generating equipment and upgrades • Solid domestic operations with strong international upside • First-mover advantage in large markets with long-term visibility (Australia and Angola)
RBC Capital Markets Energy ConferenceJune 2, 2008 Strong Experience – Focused Growth – Managing Risk