Download
1 / 8
80 likes | 254 Vues
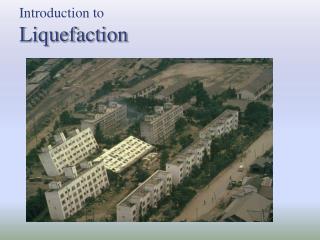
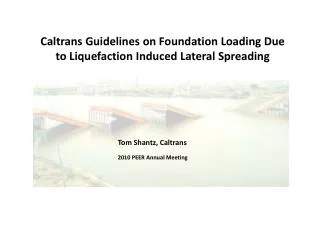
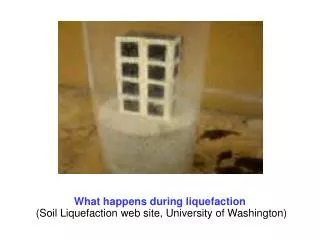
RESPONSE OF BRIDGES DUE TO LIQUEFACTION INDUCED LATERAL SPREADING. Erickson Nguon University of Auckland, New Zealand August 14, 2013. Project Overview.

E N D
RESPONSE OF BRIDGES DUE TO LIQUEFACTION INDUCED LATERAL SPREADING Erickson Nguon University of Auckland, New Zealand August 14, 2013
Project Overview • The objective of this project is to investigate and model bridge responses due to liquefaction induced lateral spreading. Specifically the Avondale Bridge in Christchurch will first be investigated. • A computer generated Ruaumokomodel of the bridges will be createdunder a displacement loading similar to the soil displacements investigated on-site. With the model the results will be validated with the actual results of the bridge. • After the model is validated sensitivity testing will be conducted.
Soil Testing at Fonterra Plant • I joined Liam Wotherspoon on his trip to the Fonterra Plant in Hawera, Taranaki, New Zealand to conduct soil testing around the plant to obtain soil profiles. • We were not able to obtain good soil profiles due to the large noise from the plant affecting the readings from the geophones. Figure 1: Geophone arrangements for soil testing on the Fonterra Plant site
Soil Testing Figure 2: The geophones that are placed into the ground 2 meters apart that pick up surface waves Figure 3: Liam’s Ph.D student, Lucas, inducing surface waves by hitting a steel plate that is sitting on the ground with a sledge hammer Figure 4: Liam at the car with his laptop reading/analyzing the data from the geophones
Ruaumoko Model • The stiffness issue I encountered was solved through the flowchart shown in Figure 5. This method of calculating the soil stiffness using the flowchart better represented the soil stiffness. • I have been creating lower, median, and upper profiles for both the North and South abutment for both the Darfield MW 7.1 earthquake and Christchurch MW 6.2 earthquake and different peak ground accelerations. • There are a lot of different profiles to analyze and compare. Figure 5: This diagram schematically summarises the calculation procedure for each of the input model parameters on the basis of the representative SPT blowcounts or undrained strength for each soil layer.
Last weekend here... Now that gay marriage is allowed in New Zealand the Sky Tower in Auckland changes its colours celebrating the news. Sky Tower changes it colors celebrating different months, holidays, and events For our last weekend we decided to go white water rafting at the Kaituna River. There is a 7 meter (~20ft) drop where I fell into the water.
Acknowledgments Thank you everybody for making this learning experience possible! • PRIME: Gabriele Wienhausen, Peter Arzberger, Teri Simas • UCSD Mentor: Lelli Van Den Einde • UofA: Liam Wotherspoon, Dmytro Dizhur