Download
1 / 29
290 likes | 464 Vues
Class 5 Micro-cantilever sensor Review of mass transport Cantilever paper Brief preview of single-molecule fluorescence. Review of last week Imagine flow cell is suddenly filled Molecules diffuse to sensor surface and stick, creating depletion region

E N D
Class 5 Micro-cantilever sensor Review of mass transport Cantilever paper Brief preview of single-molecule fluorescence
Review of last week Imagine flow cell is suddenly filled Molecules diffuse to sensor surface and stick, creating depletion region Diffusion always faster than flow over small distances because time to diffuse x is ~ x2 (1/2 the distance takes 1/4 the time), while time to flow x is ~ x, so depletion region (length d) initially grows As d increases, the diffusive flux jdiff~ D(c0 - 0)/d decreases until it is matched by convective flux into the depletion region ~Qc0. At this point d is at steady state
Time to reach equilibrium is increased (compared solution binding kinetics with complete mixing) becauseconcentration of ligand in region over sensor surface is lower than if there were no depletion zone teq @ Da trxn when Da>>1, where Da = konbmL/D(PeS)1/3
Time to reach “quasi” steady state @ time to diffuse d, which is usually (but doesn’t have to be) << time for receptors to fill up with ligand Example: if d ~ mm, D > 10-12m2/s (molecule r < 200nm) t ~ d2/D < (10-6 m)2/10-12m2/s = 1s whereas teq~koff-1@ 1/10-3s-1 = 1000s As receptors fill up with ligand, rate of removal from depletion zone drops, and d decreases until flow cell reaches real equilibrium
Details of geometry and flow rate determine shape of depletion zone and relationship between d and PeH, PeS, in quasi steady state When depletion zone extends “upstream”, d>H and d/H = 1/PeH, PeH < 1, PeH = HWD/Q When depletion zone = “sliver” over sensing surface, d/L = (1/PeS)1/3, L = length of sensing surface PeS = 6(L/H)2PeH
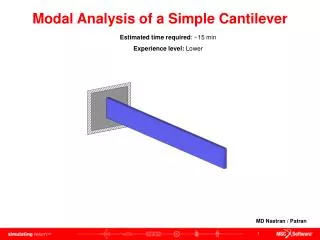
Cantilever sensor with “sample inside” Burg et al (Manalis lab) Weighing biomolecules…in fluid. Nature 446:1066 (2007) Basic mechanism of cantilever as mass sensor: fr = (1/2p)(k/me)1/2 Correcting for position of Dm along length of cantilever: fr(m+Dm) = (1/2p) [k/(me + aDm)]1/2 Dfr/fr~ -aDm/2me a = 1 if at end ¼ if evenly distributed
How do they measure resonance frequency?
How accurately can you measure dfr (and hence dm)? Depends on “sharpness” of resonance, measured by Quality factor Q = fr/width at half-max Q is also measure of damping of resonance = 2p x energy stored/energy dissipated per cycle Caveat – this Q is not the same as Qflow [vol/s]!
What limits precision in measurement of fr? Let dfr = st. dev. of repeated measurements of fr dfr/fr~ (kBT/EC)1/2 (1/Q)1/2 Ec= potential energy of driven cantilever Ekinci et al, J Appl Phys 95:2682 (2004) So Brownian motion (which limits Q) provides fundamental limit to mass detection 100-fold increase in Q -> ~ 10-fold increase in sensitivity to measure small Dm (if measurement limited only by Brownian noise)
Q in vacuum ~ 15,000 Q in water ~ 150 How important is it for cantilever to be in vacuum rather than air (given that sample is inside)? How does Q vary with viscosity?
What should depletion zone look for this device in transient steady-state before equilibrium? How long to reach equilibrium if koff= 10-3/s, KD = 1nM? Q said to be 1.6nl/s W = 3mm, L = 400mm, H = 8mm What pressure should this require? P = 12hLQ/H3W = Assume D for ligand~3*10-11m2/s (what size does this =>?) Does depletion zone extend full H? dH/H = 1/PeH = WCD/Q How far up does it extend? PeS = 6(L/H)2PeH = dS= L/(PeS)1/3 = How fast to reach equil? teq = Datrxnwhen Da>>1 Da = konbL/D(PeS)1/3 =assume b = 1012/cm2, kon = koff/KD trxn = koff-1/(1+ [L]/KD) = approx what is [L]? 3.6*104N/m2 = .4atm 7nm =1.5*10-4, so No 7*10^8 .4mm .2 500s nM
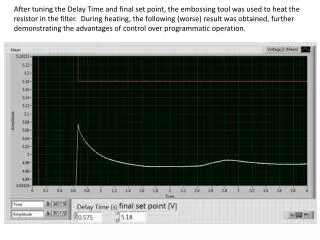
Does water inside the cantilever lead to damping? How do you estimate Q from fig 2b? What dB <-> ½ max A? Why doesn’t Fig 2b show a shift in freq. on filling with water? Doesn’t water change the mass?
Relationship between dfx and dmx for unknown x fr(me+Dm) = (1/2p) [k/(me + aDm)]1/2 =(1/2p) [k/me](1+aDm/me)-1/2 @ fr(me)(1-aDm/2me) => dfr/fr @ -aDm/2me Knowing dfr/frwhen you fill channel with water (with knownDm) you can calculate me, then det. dmx from dfx more simply, dmx/Dmw = dfr,x/Dfr,w
Reality check: What dfr/fr do you expect if you fill with water? What is mass of silicon in cantilever (2.5mm thick walls) compared to mass of water channel? Vs~ 2x(2.5/3)vw+2x(9/8)(2.5/3)vw = 3.5vwrs=2.3rw => ms@ 5.8mw dfr/frshould @ -amw/2ms @ 1/46 whereas observe ~1/10 2.5 9 3 2.5 8
Charging up device w/ capture antibody – What is coating method? PLL= poly-lys +++.. sticks to SiO2 with --- surface PEG is water-like polymer to “passivate” surface, biotin = small ring, binds NA NA = tetramer so can bind biotinylated capture Ab after sticking to bio-PEG Es Estimate mass/Hz dfr dmx = dmwdfr,x/dfr,w = 3x5x400*10-15l*103g/l* (1Hz/20,000Hz) = 3*10-13 g/Hz = 300fg/Hz How many molecules of PLL-PEG (if MW=20kDa)? ~2Hz->6*10-13g*6*1023/20000g -> 2*107 => areal density ~.2/(10nm)2
Similarly can estimate # molecules of NA (MW 60kDa) and capture Ab (MW 150kDa) that stick to surface Es Or, more simply: If NA 3x heavier than PLL and 3x df => same # molecules If IgG 2.5x heavier than NA but only 5/7thdf, (5/7) *(1/2.5) ~ .3x # of molecules (~107 IgG/Hz or 5x10⁷ total)
In steady state, AbL/AbT= (c0/KD)/(1+c0/KD) What KD would you estimate from this? c0 that give half max binding ~70nM If AbL/AbT@ 1 at 0.7mM ligand, then relative df => @ 1/10 of 5*107 total receptors bind ligand at 2nM Is Dfr consistent with Dm predicted from this # molecules?
What do you estimate for teq from this? Is this c/w your prediction from mass transport analysis? Does human IgG bind at 70nM? Why?
Does sample need to bind to inside wall of cantilever to be sensed? What is this figure supposed to illustrate? What should be the time scale of the x axis if flow is 10pl/s and cantilever vol is ~10pl?
Is 10fg the expected mass of a 100nm gold particle? (4/3)pr3r, r=19g/ml Would 30mHz shift be reliable dfr in protein binding (fig 3)? Why might they do better here? (a and drift time) This suggests they can detect 10fg, but they claim 1 fg (resolution) in supplementary table
Area 104mm2 1cm2 1mm2 Exercise – convert total mass to # molecules. MW = 105g/6*1023 -> 1/6ag (=10-18g)/molecule More realistic measure of cantilever sensitivity for protein is .1Hz ~30fg
They also claim they can detect pM ligand with nM KDAb based on 1/1000 Ab’s binding ligand -> ~105 ligand molecules, ~20fg But fig 3 suggests not much better than nM LOD
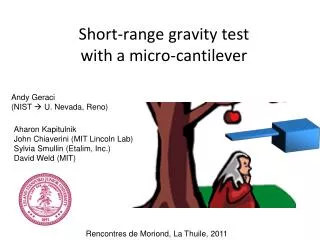
Could they get ~106-fold sensitivity increase (detect single molecules) if they did a sandwich assay by flowing in 100nm gold nanoparticles (np) coated with 20 antibody? A tethered gold np could act as a “mass amplifier” Would the drag force on a tethered gold np be large enough to break an antigen-antibody bond? Empirically, such bonds are stable for several minutes at ~5pN force. Estimate Fdrag = 6phrv for bead ~100nm from surface at 1/3 atm pressure driving flow
Why might bacteria have a broader distribution of frequency shifts than the gold beads? How big are bacteria compared to channel dimensions? What might you worry about?
Can devices be re-used for multiple assays? Without subtracting change due to 1mg/ml BSA in sample Remarkable reproducibility after regenerating surface with acetic acid/H2O2! So (presumably mod. expensive) chips could be reused.
Summary Very nice idea of putting flow cell inside cantilever! Do they need fancy vacuum? How does Q vary with h? Sensitivity for mass detection ~5x10⁶ protein molecules ~2nM at standard KD in “label-free” mode; similar to ELISA! Nice idea of counting particles (that change mass > 10 fg) as they flow through Could it be used in sandwich format with “mass amplifier np” to detect single protein molecules?
Next week: immuno-assay with single-molecule sensitivity based on fluorescence labels and Total Internal Reflection Fluorescence Microscopy (TIRFM) Read Jain et al Nature 473:484 (2011) Basic idea – capture analyte on transparent surface introduce fluorescent label (e.g. on second ab) record fluorescent image using TIRFM negative control sample
TIRF microscopy reduces background, allowing detection of single fluorescent molecules Jargon - sorry protein names: YFP, PKA, ADAP, mTor, etc. epitopes (= small chemical features, can be peptides, that antibodies bind to): FLAG, HA fluorescent proteins (e.g. from jellyfish, corals): often named for emission color yellow (YFP), red (mCherry) IP = immunoprecipitation, here usually means capture of analyte on surface by antibody FRET – Fluorescence Resonance Energy Transfer: when different fluors are within nm of each other, excited state can transfer -> altered em. color photobleaching – light-induced chem. change killing fluor.
Authors describe technique mainly for research purposes: e.g. to detect what other proteins a test protein binds to, or how many molecules in a complex Our focus: how does this method compare to others as a sensor Issues to think about as you read: background, dynamic range, field of view size, potential for automation, cost