Download
1 / 124
1.25k likes | 1.58k Vues
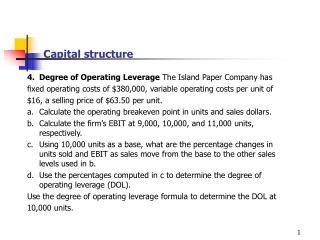
Capital Structure Basics. Chapter 13. Learning Objectives. Break-even level of sales. Operating and financial leverage and risk. Risks and returns of leveraged buy-outs (LBOs). Effect of capital structure on value. Break-even Analysis. Steps to Solution

E N D
Capital Structure Basics Chapter 13
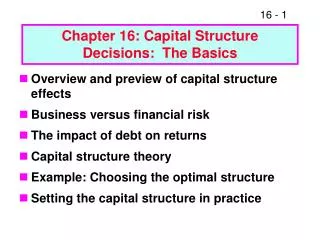
Learning Objectives • Break-even level of sales. • Operating and financial leverage and risk. • Risks and returns of leveraged buy-outs (LBOs). • Effect of capital structure on value.
Break-even Analysis • Steps to Solution • Construct a chart to find the sales break-even point = level of sales necessary to cover operating (not financial) costs. • This requires that you calculate EBIT for different unit sales amounts. • The point at which EBIT = 0 is the break-even level of sales.
Costs $ Units Produced Break-even Analysis • Assumptions • Fixed costs remain constant as quantity changes. • Variable costs vary as quantity of output changes. Variable Costs Fixed Costs
Fixed vs. Variable Costs • Fixed costs may include salaries, depreciation, rent. • Variable costs may include commissions, materials, labor. • This is a generalization. For example, some salaries may be considered fixed and others variable. In the long-run all costs are variable.
EBIT = Sales – Variable Costs - Fixed Costs Break-even Analysis • Calculation of Break-even Quantity Find Quantity which results in EBIT = $0
FC p – vc Unit Salesbe = Break-even Analysis • Calculation of Break-even Quantity Where: Unit Salesbe = Break-even quantity FC = Total fixed costs p = Sales price per unit vc = Variable costs per unit
FC p – vc Unit Salesbe = Break-even Analysis • Calculation of Break-even Quantity Example: Fixed Costs = $1,000,000/year Price = $800/unit Variable Costs = $400/unit
FC p – vc Unit Salesbe = $1,000,000 $800 – $400 = = 2,500 units Break-even Analysis • Calculation of Break-even Quantity Example: Fixed Costs = $1,000,000/year Price = $800/unit Variable Costs = $400/unit
TR = p x Q Break-even Analysis • Now calculate total revenue. p = Sales price per unit Q = unit sales
TR = p x Q Break-even Analysis • Calculate total revenue for different levels of sales. Unit sales (Q) xPrice (p)= Total Revenue (TR) 0 x $800 = $ 0 500 x $800 = $ 400,000 1,000 x $800 = $ 800,000 2,000 x $800 = $1,600,000 2,500 x $800 = $2,000,000
TotalCosts Variable Costs Fixed Costs Quantity Produced Graphical Analysis of Break-even point Step 1:
TotalCosts Variable Costs Fixed Costs Quantity Produced Graphical Analysis of Break-even Point Step 2: Total Costs $1,000,000
TotalCosts & Revenue Variable Costs Fixed Costs Quantity Produced & Sold Graphical Analysis of Break-even Point Step 3: Total Revenue Total Costs $1,000,000
The Break-even Graph • The slope of the total revenue line is p, the price per unit. • The slope of the total cost line is vc, the variable cost per unit.
TotalCosts & Revenue Total Revenue Variable Costs Fixed Costs $1,000,000 Quantity Produced & Sold Graphical Analysis of Break-even Point Total Costs $2,000,000 Qbe = 2,500
The Concept of Leverage You cannot easily move a large boulder.
The Concept of Leverage However, with the aid of a lever you can move an object many times your size.
The Concept of Leverage The longer the lever, the bigger the rock you can move.
The Concept of Leverage • In a financial context, the magnifying power of leverage can be used to help (or hurt) a firm’s financial performance. • Operating leverage occurs due to fixed costs in the production process. • With high fixed operating costs, a small change in sales will trigger a large change in operating income (EBIT).
% Change in EBIT % Change in Sales DOL= Operating Leverage • Measurement of Operating Leverage • Degree of Operating Leverage (DOL) • DOL > 1 means the firm has operating leverage.
% Change in EBIT % Change in Sales DOL= 100 33.33 ($1 - $.5) / $.5 ($4 - $3) / $3 DOL= = = 3.0 Operating Leverage • Example:S1 = 3,750 units S2 = 5,000 units • FC = $1mil and VC = $400/unit P = $800/unit • Sales of 3,750 units = (3,750 * $800) = $3mil • EBIT = $3mil - $1mil – $1.5mil= $.5mil • Sales of 5,000 units = (5,000 * $800) = $4mil • EBIT = $4mil - $1mil - $2mil = $1mil
Sales - Total VC Sales -Total VC - FC DOL= Operating Leverage • Measurement of DOL • Calculation using alternate formula:
Sales - Total VC Sales -Total VC - FC DOL= Operating Leverage • Measurement of DOL • Calculation using alternate formula: DOL = ($3 - $1.5) / ($3 - $1.5 - $1) = 1.5 / .5 = 3
Sales - Total VC Sales -Total VC - FC DOL= Q = 3,750 units P = $800 per unit VC = $400 per unit FC = $1,000,000 per year. Example: Operating Leverage • Measurement of DOL • Calculation using per unit information:
Sales - Total VC Sales -Total VC - FC DOL= 3,750(800) – 3,750(400) 3,750(800) –3,750(400) – 1,000,000 DOL3,750 units = Operating Leverage • Measurement of DOL • Calculation using per unit information: Interpretation: If sales change 1%, then EBIT will change 3% (same direction). = 3
Quantity DOL 2,500 (Qbe) Undefined 3,250 4.33 3,750 3 5,000 2 Operating Leverage • Degree of Operating Leverage falls as sales rise
Quantity DOL 2,500 (Qbe) Undefined 3,250 4.33 3,750 3 5,000 2 Operating Leverage • Degree of Operating Leverage falls as sales rise • The higher the sales level above break-even, the less the percent change in EBIT for a given percent change in sales • If FC = $0, DOL = 1
Leverage Table Number 1
% Change in NI % Change in EBIT DFLEBIT = Financial Leverage • Degree of Financial Leverage • Finance a portion of the firm’s assets with securities that have fixed financial costs • Debt • Preferred Stock • Financial Leverage measures changes in earnings per share as EBIT changes. Base Level of EBIT
% Change in NI % Change in EBIT DFL= 167 100 (480.6 - 180) / 180 ($1 - $.5) / $.5 DFL= = = 1.67 Financial Leverage Example: EBIT1 = $500,000 EBIT2 = $1,000,000 NI1 = $180,000 NI2 = $480,600
EBIT EBIT – I DFLEBIT = Financial Leverage • Measurement of DFL (Alternate formula) • If DFL > 1, the firm has financial leverage. A given percent change in EBIT will result in a larger percent change in NI.
500,000 500,000 – 200,000 DFLEBIT=500,000 = Financial Leverage Example: EBIT = $500,000 Interest Charges = $200,000 = 1.67 times Interpretation: When EBIT changes 1% (from an existing level of $50,000) Net Income will change 1.67% in the same direction. Link to CBS Market Watch
Leverage Table Number 1
% Change in NI % Change in Sales DCLS = Combined Leverage • Degree of Combined Leverage • Measures changes in Net Income given changes in Sales • Combines both Operating and Financial Leverage • Computed for a specific level of sales Base Level of Sales
% Change in NI % Change in Sales DCL= 166.7 33.3 (480.6 - 180) / .180 ($4 - $3) / $3 DCL= = = 5.0 Combined Leverage Example: SALES1 = $3,000,000 SALES2 = $4,000,000 NI1 = $180,000 NI2 = $480,600
DCLS = DOLS x DFLEBIT Example: DOLS = 3.0 DFLEBIT = 1.67 Combined Leverage DCL3,750 = 3.0x 1.67 = 5.0 times
Sales – VC Sales - VC - FC - I DCLS = 3,750(800) – 3,750(400) 3,750(800) – 3,750(400) – 1,000,000 - $200,000 DCL3,750 = 3 mil – 1.5 mil 3 mil – 1.5 mil – 1 mil - .2 mil = Combined Leverage Example: = 1,500,000 300,000 = 5
DCLS = DOLS x DFLEBIT DCLS = DOLS x DFLEBIT Example: DOLS = 3.0 DFLEBIT = 1.67 Combined Leverage DCL3,750 = 3.0x 1.67 = 5.0 times Interpretation: When sales change 1%, Net Income will change 5.0% in the same direction
Leverage Table Number 1
Effect of Leverage • Leverage can help the firm or hurt it. • If EBIT increases, financial leverage will magnify the increase in net income. • If EBIT decreases, financial leverage will magnify the decrease in net income.
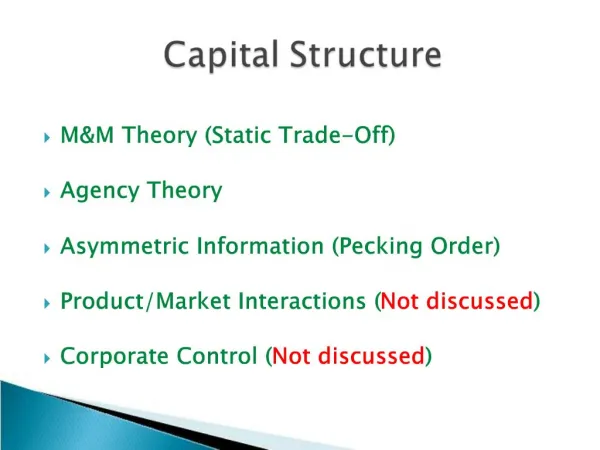
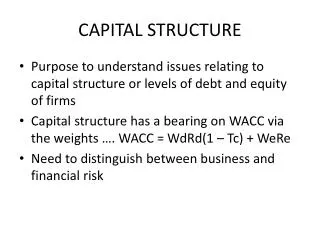
Capital Structure Theory • Capital Structure is the mixture of sources of funds a firm uses. • Debt • Preferred Stock • Common Stock
Capital Structure Theory • A benefit of debt financing is that interest is tax deductible to the paying firm whereas payments to equity providers are not. • Firms must trade-off this benefit against the increased financial risk associated with higher debt levels.
Capital Structure TheoryModigliani and Miller (M&M) • M&M wrote an important paper in 1958 in which they proved that with certain assumptions there is no optimal capital structure. One is as good as any other. • M&M’s Assumptions: No transaction costs, no taxes, everyone has same information and borrowing rates, debt is riskless, debt does not affect operations.
Capital Structure TheoryModigliani and Miller (M&M) • In a later paper, M&M showed that when the tax deductibility of interest is considered, their model indicates that a capital structure of 100% debt is optimal.
Capital Structure in the Real World • Firms attempt to balance the costs and benefits of debt to reach the optimal mix that maximizes the value of the firm. • Affect on costs of capital: • Since debt is cheaper than equity, use of debt will initially lower the WACC. • At high levels of debt, the WACC will increase as investors perceive the risk of the firm to be increasing substantially.
Cost of Capital and Capital Structure ke ka K* kd
Corporate Bonds, Preferred Stock, and Leasing Chapter 14
Learning Objectives • Bond contract terms • Differences among types of bonds • Features of preferred stock • Lease versus purchase • Balance sheet treatment of leases
Bond Basics • Bondholders are lending the corporation funds for some stated period of time. • The corporation promises to make certain payments to the owner of the bond.