Download
1 / 21
210 likes | 299 Vues
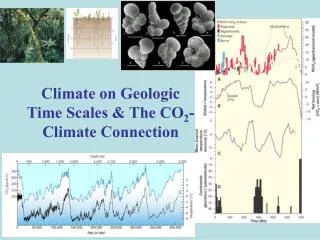
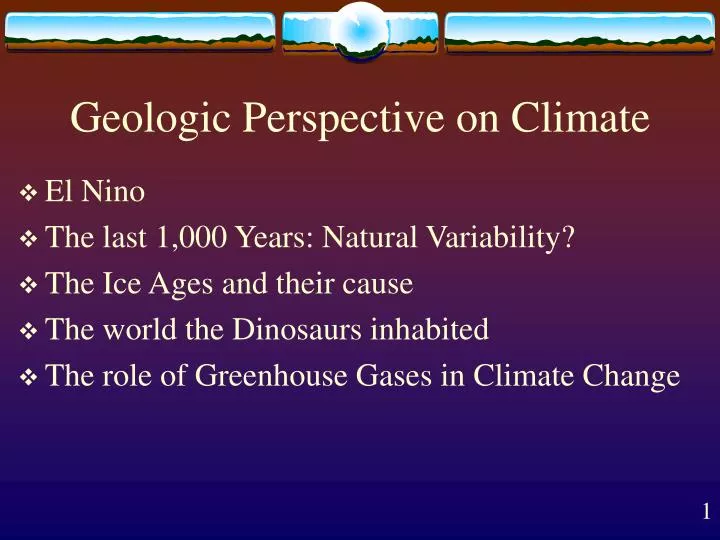
Geologic Perspective on Climate. El Nino The last 1,000 Years: Natural Variability? The Ice Ages and their cause The world the Dinosaurs inhabited The role of Greenhouse Gases in Climate Change. Normal Pacific Circulation. http://elnino.noaa.gov/index.html. El Nino Pacific Circulation.

E N D
Geologic Perspective on Climate • El Nino • The last 1,000 Years: Natural Variability? • The Ice Ages and their cause • The world the Dinosaurs inhabited • The role of Greenhouse Gases in Climate Change
Normal Pacific Circulation http://elnino.noaa.gov/index.html
El Nino Pacific Circulation http://elnino.noaa.gov/index.html
Current El Nino Sea Surface Temperature Animation http://www.cdc.noaa.gov/map/clim/sst_olr/el_nino_anim.shtml
Sources of past climate information • Historical records • Tree rings • Sediments • Marine and lacustrine • Corals • Ice cores
The Last 1,000 Years Crowley, Fig. 1
The Last 18,000 Years Last Glacial Maximum Crowley, Fig. 2
Iowa 16,000 Years Ago? Graphic from Illinois State Museum
Ice on the Retreat! Graphic from Illinois State Museum
The Last 160,000 Years Interglacial Glacial Crowley, Fig. 3
The Milankovitch Theory • Changes in the amount of solar insolation reaching the Earth at 65°N latitude during the summer drive the waxing and waning of the ice sheets • Low summer insolation = glaciers build up • High summer insolation = glaciers melt http://earthobservatory.nasa.gov/Library/Giants/Milankovitch/milankovitch_2.html
GreenhouseGas Concentrations Crowley, Fig 4 See Fig. 15.14
The Last 800,000 Years More often glacial (cold) than interglacial (warm) in last million years !! Crowley, Fig. 5
The Last 100 Million Years GH: ~200 My ~350 My ~500 My GREENHOUSE WORLD ICEHOUSE WORLD IH: ~290 My ~450 My ~680 My ~750 My ~950 My ~2300 My Crowley, Fig. 6
The Geologic History of Ice Ages Source: http://www.lakepowell.net/sciencecenter/paleoclimate.htm
Lush but Dangerous World Crowley points out that if we burn all of the fossil fuel that is available to us, most of which is in the form of coal, CO2 levels would likely rise to those associated with the Cretaceous period, ~150 to 65 million years ago. The Cretaceous had: - no ice - vegetation all the way to the poles - cold-blooded animals (dinosaurs) If all the ice were to melt, sea level would rise 70 m (~200 ft)