Download
1 / 40
420 likes | 742 Vues
Complex networks and random matrices. Geoff Rodgers School of Information Systems, Computing and Mathematics. Plan. Introduction to scale free graphs Small world networks Static model of scale free graphs Eigenvalue spectrum of scale free graphs Results Conclusions. Scale Free Networks.

E N D
Complex networks and random matrices. Geoff Rodgers School of Information Systems, Computing and Mathematics
Plan • Introduction to scale free graphs • Small world networks • Static model of scale free graphs • Eigenvalue spectrum of scale free graphs • Results • Conclusions.
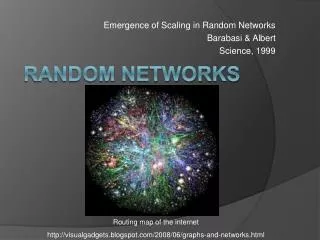
Scale Free Networks Many of networks in economic, physical, technological and social systems have been found to have a power-law degree distribution. That is, the number of vertices N(m) with m edges is given by N(m) ~ m -
Network Nodes Links/Edges Attributes World-Wide Web Webpages Hyperlinks Directed Internet Computers and Routers Wires and cables Undirected Actor Collaboration Actors Films Undirected Science Collaboration Authors Papers Undirected Citation Articles Citation Directed Phone-call Telephone Number Phone call Directed Power grid Generators, transformers and substations High voltage transmission lines Directed Examples of real networks with power law degree distributions
Web-graph • Vertices are web pages • Edges are html links • Measured in a massive web-crawl of 108 web pages by researchers at altavista • Both in- and out-degree distributions are power law with exponents around 2.1 to 2.3.
Collaboration graph • Edges are joint authored publications. • Vertices are authors. • Power law degree distribution with exponent ≈ 3. • Redner, Eur Phys J B, 2001.
These graphs are generally grown, i.e. vertices and edges added over time. • The simplest model, introduced by Albert and Barabasi, is one in which we add a new vertex at each time step. • Connect the new vertex to an existing vertex of degree k with rate proportional to k.
For example:A network with 10 vertices. Total degree 18.Connect new vertex number 11 to vertex 1 with probability 5/18 vertex 2 with probability 3/18 vertex 7 with probability 3/18 all other vertices, probability 1/18 each.
This network is completely solvable analytically – the number of vertices of degree k at time t, nk(t), obeys the differential equation where M(t) = knk(t) is the total degree of the network.
Simple to show that as t nk(t) ~ k-3 t power-law.
Small world networksNormally defined by two properties: Local order: If vertices A and B are neighbours and B and C are neighbours then good chance that A and C are neighbours. Finite number of steps between any pair of vertices (this is the small world effect).
Property 1 is generally associated with regular graphs e.g. 2-d square network. Property 2 is generally associated with random graphs or mean field systems.
Scale free networks are small world. But not all small world networks are scale free.
Models of small world networks • Most famous due to Newman and Watts: • Let n sites be connected in a circle. • Each of several neighbours is connected by a unit length edge. • Then each of these edges is re-wired with probability p to a randomly chosen vertex.
p = 0 is a regular ordered structure. • p = 1 is an ER random graph. • Small world for 0 < p < 1. • Average shortest distance behaves as ~ n for p = 0 and ~ log n for p > 0.
Obviously such an approach can be generalised to any regular graph, 2-d, 3-d etc… • Models are difficult to formulate analytically. • Only some of the most basic properties have been obtained analytically, in contrast to both random and scale free graphs.
Static Model of Scale Free Networks • An alternative theoretical formulation for a scale free graph is through the static model. • Start with N disconnected vertices i = 1,…,N. • Assign each vertex a probability Pi.
At each time step two vertices i and j are selected with probability Pi and Pj. • If vertices i and j are connected, or i = j, then do nothing. • Otherwise an edge is introduced between i and j. • This is repeated pN/2 times, where p is the average number of edges per vertex.
When Pi = 1/N we recover the Erdos-Renyi graph. When Pi ~ i-α then the resulting graph is power-law with exponent λ = 1+1/ α.
The probability that vertices i and j are joined by an edge is fij, where fij = 1 - (1-2PiPj)pN/2 ~ 1 - exp{-pNPiPj} When NPiPj <<1 for all i ≠ j, and when 0 < α < ½, or λ > 3, then fij ~ 2NPiPj j
Adjacency Matrix The adjacency matrix A of this network has elements Aij = Aji with probability distribution P(Aij) = fijδ(Aij-1) + (1-fij)δ(Aij).
This matrix has been studied by a number of workers • Farkas, Derenyi, Barabasi & Vicsek; Numerical study ρ(μ) ~ 1/μ5 for large μ. • Goh, Kahng and Kim, similar numerical study; ρ(μ) ~ 1/μ4. • Dorogovtsev, Goltsev, Mendes & Samukin; analytical work; tree like scale free graph in the continuum approximation; ρ(μ) ~ 1/μ2λ-1.
We will follow Rodgers and Bray, Phys Rev B 37 3557 (1988), to calculate the eigenvalue spectrum of the adjacency matrix.
Introduce a generating function where the average eigenvalue density is given by and <…> denotes an average over the disorder in the matrix A.
Normally evaluate the average over lnZ using the replica trick; evaluate the average over Zn and then use the fact that as n → 0, (Zn-1)/n → lnZ.
We use the replica trick and after some maths we can obtain a set of closed equation for the average density of eigenvalues. We first define an average [ …],i where the index = 1,..,n is the replica index.
The function g obeys and the average density of states is given by
Hence in principle we can obtain the average density of states for any static network by solving for g and using the result to obtain (). • Even using the fact that we expect the solution to be replica symmetric, this is impossible in general. • Instead follow previous study, and look for solution in the dense, p when g is both quadratic and replica symmetric.
In the limit n 0 we have the solution where a() is given by
Random graphs: Placing Pk = 1/N gives an Erdos Renyi graph and yields as p → ∞ which is in agreement with Rodgers and Bray, 1988.
Scale Free Graphs To calculate the eigenvalue spectrum of a scale free graph we must choose This gives a scale free graph and power-law degree distribution with exponent = 1+1/.
When = ½ or = 3 we can solve exactly to yield where note that
General • Can show that in the limit then
Conclusions • Shown how the eigenvalue spectrum of the adjacency matrix of an arbitrary network can be obtained analytically. • Again reinforces the position of the replica method as a systematic approach to a range of questions within statistical physics.
Conclusions • Obtained a pair of simple exact equations which yield the eigenvalue spectrum for an arbitrary complex network in the high density limit. • Obtained known results for the Erdos Renyi random graph. • Found the eigenvalue spectrum exactly for λ = 3 scale free graph.
Conclusions • In the tail found In agreement with results from the continuum approximation to a set of equations derived for a tree-like scale free graph.
Conclusions • The same result has been obtained for both dense and tree-like graphs. • These can be viewed as at opposite ends of the “ensemble” of scale free graphs. • This suggests that this form of the tail may be universal.
Further details • Eigenvalue spectrum Rodgers, Austin, Kahng and Kim J Phys A 38 9431 (2005). • Spin glass Kim, Rodgers, Kahng and Kim Phys Rev E 71 056115 (2005).