Download
1 / 18
180 likes | 414 Vues
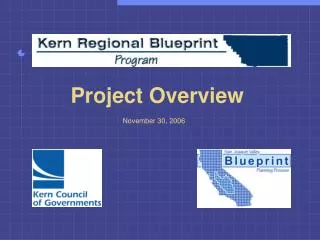
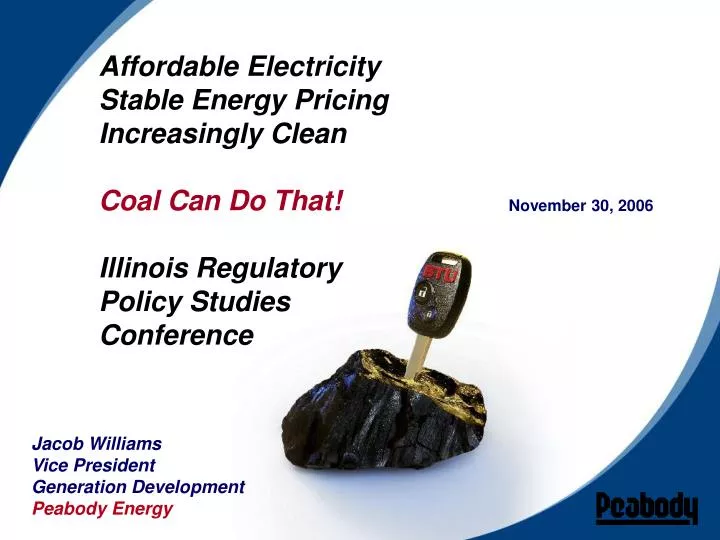
Affordable Electricity Stable Energy Pricing Increasingly Clean Coal Can Do That! Illinois Regulatory Policy Studies Conference. November 30, 2006. Jacob Williams Vice President Generation Development Peabody Energy. World’s Largest Coal Company: Peabody’s Base Portfolio of Operations.

E N D
Affordable Electricity Stable Energy Pricing Increasingly Clean Coal Can Do That! Illinois Regulatory Policy Studies Conference November 30, 2006 Jacob WilliamsVice PresidentGeneration DevelopmentPeabody Energy
World’s Largest Coal Company:Peabody’s Base Portfolio of Operations 2005 Market Position Sales Reserves Wyoming PRB #1 126 3,327 Midwest #1 38 4,174 Southwest #1 18 980 Colorado#1 11 252 Appalachia#6 14 584 Australia#5 30* 817* Venezuela#1 7 175 Millions of short tons St. Louis Dominion Terminal Port of Santa Cruz Dalrymple Bay Terminal Venezuela Port of Gladstone Queensland Port of Brisbane New South Wales Port of Newcastle Port Kembla • Pro forma including Excel (and operations in development).2005 sales volume in millions of short tons. Venezuela sales volume for Paso Diablo Mine, of which Peabody owns a 25.5% interest. Reserves based on 2005 proven and probable for areas shown. Source: Peabody analysis & industry reports.
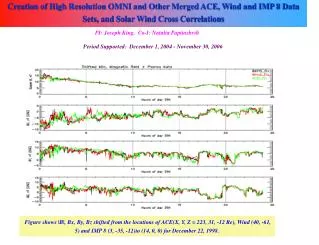
Global Coal Use Soars 23%, or 1 Billion Tons, in 4 Years Four-Year Percent Change in Global Energy Consumption 4% Nuclear 8% Oil 12% 2001 - 2005Change Hydro 12% Natural Gas 23% Coal Source: BP Statistical Review of World Energy, 2006 edition.
Developing Countries Will Greatly Expand Per-Capita Energy Use Electricity Usage per Capita Passenger Vehicles per Capita Per-Capita Coal Use Just 1/3rd (China) and 1/9th (India) the U.S. Level Source: United Nations’ Human Development Report 2005, World Energy Outlook & ConocoPhillips.
Developing Regions Drive Energy Consumption Growth Total Primary Energy Consumption by Region 122.5% Growth from 2002 37.7% Growth from 2002
Like Oil, Natural Gas SuppliesRely on High-Risk Regions Most Gas Reserves Are in the Middle East and Asia
High Oil & Gas PricesMagnify Coal’s Competitive Advantage Prairie State Advantage Significant Reduction of Delivered Fuel Cost Volatility NYMEX Residual Fuel Oil (Conv.) Natural Gas NYMEX Henry Hub Futures Residual Fuel Oil Coal Deliveries 1998 1999 2000 2001 2002 2003 2004 2005 2006 2007 2008 2009 2010 2011 Delivered cost of fossil fuel at steam electric utility plants. Source: Platts Fossil-Fuel Receipts at Steam-Electric Utility Plants through November 2005. EIA February 2006 Short-Term Energy Outlook, December 2005 – December 2006. NYMEX HH Futures November 2007 – December 2011, ino.com on October 17, 2006.
Gas/Power Procurement: Timing is Everything Calendar 2007 Henry Hub Gas Price Daily Average 2007 Henry Hub Price Illinois Power Procurement Date Daily Maximum 2007 Henry Hub Price Daily Minimum 2007 Henry Hub Price 2007 Gas Prices Drop Over $1.00/mmbtu ($7–8/MWh) after Auction
Gas/Oil Set Electric Market Price Almost 50% of the Time % Hours Gas/Oil Generation Marginal Fuel Wood MacKenzie North American Power Outlook: 2006-2026, August 2006.
Over 51% of U.S. Electricity is from CoalSource of Low Cost Electricity in U.S. Retail Cost Per kWh & Percent of Coal Generation 12.11¢ 2% 6.0¢ 10% 6.0¢ 95% 6.7¢ 65% 7.0¢ 63% 6.5¢ 7% 8.1¢ 70% 5.0¢ 1% 6.7¢ 46% 8.4¢ 58% 5.2¢ 96% 8.7¢ 56% 7.1¢ 78% 6.1¢ 67% 7.7¢ 87% 9.5¢ 46% 6.5¢ 94% 7.2¢ 48% 5.0¢ 98% 6.1¢ 96% 6.9¢ 45% 7.8¢ 72% 12.9¢ 1% 7.0¢ 75% 6.5¢ 85% 5.5¢ 91% 7.5¢ 61% 7.0¢ 61% NH 14.0¢ 17% VT 11.4¢ 0% MA 15.6¢ 25% RI 14.1¢ 0% CT 14.5¢ 12% NY 13.8¢ 14% NJ 12.0¢ 19% DE 9.2¢ 60% MD 9.8¢ 56% 7.5¢ 53% 6.9¢ 39% 6.9¢ 49% 8.2¢ 39% 7.4¢ 89% ¢ = average retail price per kilowatt hour through 8/06 % = percent of total generation from coal for CY 2005 7.8¢ 65% 7.1¢ 57% 8.4¢ 37% 10.4¢ 38% 8.3¢ 25% 10.4¢ 28% <6.5¢ > 6.5¢ -<8.0¢ > 8.0¢ - < 9.5¢ > 9.5¢ - <11.0¢ > 11.0¢ Hydro 20.9¢ 14% 12.8¢ 10% Source: Energy Information Administration, November, 2006.
Coal-Based Electricity Increased 80% Since 1980 While Emissions Improved Reductions Continue with Existing Plants actual forecast Source: U.S. Environmental Protection Agency, IEA Annual Energy Outlook 2005.
Prairie StateLow-Cost,Low Emissions Energy Cleanest Coal plant in Illinois if On-line Today 0.93 0.63 0.39 0.32 0.26 0.26 0.182 0.16 0.13 0.07 U.S. Average 2005 Clean Air Interstate Rule 2015 Prairie State Permit Limit Illinois Average 2005 Clean Air Interstate Rule 2010 Source: EPA National Air Markets Program; EIA Annual Review 2005
40 miles Southeast of St. Louis in Illinois 1,600 MW supercritical generating plant fueled by 6+ million ton/year adjacent mine Received all permits needed to operate plant Cleanest coal plant in Illinois and 15% more CO2 efficient than existing coal fleet 53% of project owned by a group of Midwestern municipals and cooperatives Additional 30% of ownership is committed CMS and Peabody Average 2,000 construction jobs over 4 years and 450 long-term jobs Targeting generation in the 2011 timeframe Prairie State Energy Campus New Low-Cost, Clean Coal Generation Prairie State Energy Campus Washington County, Illinois
1. Wolverine Power Supply Cooperative, Inc. Abbreviation: WPSC 400,000 people served 2. Northern Illinois Municipal Power Agency Abbreviation: NIMPA 52,000 people served 3. Missouri Joint Municipal Electric Utility Commission Abbreviation: MJMEUC 800,000 people served 4. Soyland Power Cooperative, Inc. Abbreviation: Soyland 156,000 people served 5. Indiana Municipal Power Agency Abbreviation: IMPA 340,000 people served 6. Kentucky Municipal Power Agency Abbreviation: KMPA 54,000 people served 1 2 4 5 3 6 Prairie State Partners Serve Nearly 2 Million People In 5 States
Transmission Enhancements Needed to Access Broader Electricity Market Legend: Coal Natural Gas Nuclear 7 Only 1 HV Transmission Path Connecting Northern to Central/Southern Illinois Existing HV Transmission Lines 2 10 1 Potential HV Transmission Lines 3 5 Existing HV Transmission Path 8 1 Prairie State Potential HV Transmission Path 9 6 6 4
Potential Improvements in Illinois Electric Procurement Process • Enhance transmission into the State and within the State to allow: • More out-of-state generation to bid in to Illinois auction • More generation within Illinois to bid Intrastate (North to South and South to North) • Few bids from out-of-state low cost generators (AES IPL, Associated Electric, Cinergy, EKPC, KCP&L, LGE, MidAmerican, NIPSCO & Vectren) • Portion of power could be purchased on much longer term (10 – 20 years) basis to foster new, very clean coal and renewable resource competition • Old coal and nuclear units could never had been built with 3 year contracts • Procure power at different times throughout the year to avoid potentially buying all at an absolute or relative peak price period. • Procure power in “natural” generation abilities, not just full requirements. More generators able to compete.
30% ownership inEcono-Power International PRB and Illinois Basin coal transformed into low-Btu gas Cost effective at $5 to $6/mmBtu Peabody Participating in MultipleBtu Conversion Opportunities Gasification (Industrial or Pipeline) Liquefaction Hydrogen • Peabody part of FutureGen Industrial Alliance • Goal: Generation and hydrogen; near-zero emissions; CO2 sequestration • Alliance includes Southern Company, AEP, Huaneng • $700 million from DOE; $250 million from industry Planned “Coal to Diesel” Plant in Inner Mongolia, China • High gas prices point to need for coal-to-liquids • Coal-to-liquids at $35 – $40/barrel oil • Peabody partnership with Rentech for coal to liquids plant • Agreement with Arclight to evaluate Illinois location for pipeline-quality gas • ConocoPhillips and Fluor participating in technology and plant design • Pipeline-quality natural gas competitive as low as $6 per mmBtu
Steps to AchieveAffordable Energy and Increasing Clean • Coal-based generation and Btu conversion projects must play a major role to provide affordable energy in the US • Lead times on these projects from conception to completion are 6 – 10 years and significant resources ($10 – 20 M during permitting) • Require predictable permit and appeal timelines • Capital intensive investment (multiple billions) with asset life of 30 – 40 years • Require implicit (ratebase) or explicit long term contracts to finance • Coal-based generation and Btu conversion projects are part of the solution to an increasingly clean environment.