Download

1 / 39
870 likes | 2.07k Vues
Introduction to Quantitative Research Methods. MEd Support Session 25 March 2013 Dr Surette van Staden. Research Methodology. Quantitative Research Inferring evidence for a theory through measurement of variables that produce numeric outcomes. Qualitative research

E N D
Introduction to Quantitative Research Methods MEd Support Session 25 March 2013 Dr Surette van Staden
Research Methodology Quantitative Research • Inferring evidence for a theory through measurement of variables that produce numeric outcomes Qualitative research • Extrapolating evidence for a theory from what people say or write
Choice of Quantitative Research Design • Primary research objective • What is happening? (descriptive research) • Why is it happening? (predictive and explanatory research) • Time dimension (cross-sectional, longitudinal, retrospective) • Scaling of the dependent and independent variable(s)
Quantitative Research: Proposal Components • Research design • Research methods • Sample of participants • Instruments • Data collection • Data analysis • Methodological norms (Validity and reliability)
Important Concepts to Understand • Dependent variable • Independent variable • Alternative hypothesis • Null hypothesis • Error • Measurement error • Sampling error • Random error
Research Design • Research design encompasses all the methodology and procedures employed to conduct scientific research. • Research design provides the glue that holds the project together. • It is used to structure the research and shows how all the parts – sample, instruments, data collection etc. – all work together to answer the question. • The purpose of research design is to avoid invalid inferences.
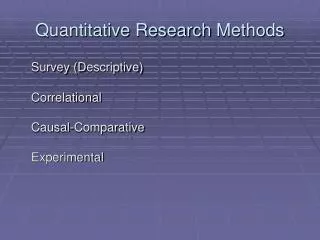
Types of Quantitative Design • Correlational research design • Causal-comparative research design • Experimental design • Survey design
Correlational Research • Observing what naturally goes on without direct interference • No manipulation of the independent variable • No random assignment of members to a group • Example: Do male students learn better than female students in scientific/technical subject areas?
Correlational Research (continued) • Non-manipulated variables (naturally occurring variables): • Age • Sex • Ethnicity • Learning style • Socioeconomic status • Parental education levels • Family environment • Preschool attendance • Type of school
Correlational Research (continued) CAUTION! Association vs. causation • Examples: • Schools with classroom libraries have learners with higher average reading achievement performance • Women who undergo plastic surgery procedures are more likely to commit suicide Presence of confounding variables/tertium quid (3rd person)
Correlational Research (continued) Establishing correlation through Pearson Correlation Coefficient (r): - standardised measure of the strength of a relationship between two variables - An effect size measure that is confined to lie between -1 (no effect) to 1 (perfect effect) Meaning of values: • -1: increase in one variable, decrease in the other • 0: change in one variable, no change in the other • 1: as one variable changes, so does the other in the same direction
CAUSAL COMPARATIVE RESEARCH • Attempts to determine cause and effect • Not as powerful as experimental designs • Alleged cause and effect have already occurred and are being examined after the fact (ex post facto) • Used when independent variables cannot or should not be examined using controlled experiments • A common design in educational research studies
CAUSAL COMPARATIVE RESEARCH (continued) Similarities to Correlational Research: • Both designs lack manipulation of the independent variable • Both designs require caution in interpreting results - Causation is difficult to infer • Both can support subsequent experimental research - Results can lead to testable experimental hypotheses
CAUSAL COMPARATIVE RESEARCH(continued) Correlational Causal Comparative • No attempts to understand cause and effect • Two or more variables • One group • Attempts to understand cause and effect • At least one independent variable • Two or more groups
CAUSAL COMPARATIVE RESEARCH (continued) Example: Relationship between years of experience and job satisfaction Correlational research: Hypotheses: Alternative: There is a relationship between years of teaching experience and job satisfaction Null: There is no relationship between years teaching experience and job satisfaction Sample: One group (teachers), randomly sampled Variables: Years of teaching experience, job satisfaction
CAUSAL COMPARATIVE RESEARCH (continued) Example: Relationship between years of experience and job satisfaction Correlational research: Data analysis: - Correlation computed between the two variables (Pearson’s Correlation) within the group to test the null hypothesis. - Rejection of the null hypothesis suggests that there is a relationship between years of teaching experience and job satisfaction. - Direction (positive or negative) and strength of r determines nature of the relationship.
CAUSAL COMPARATIVE RESEARCH (continued) Example: Relationship between years of experience and job satisfaction Causal comparative research: Hypotheses: Alternative: Teachers with a high level of experience will be more satisfied with their jobs than teachers with low levels of experience. Null: Teachers with a high level of experience will be equally satisfied with their jobs when compared to teachers with low levels of experience. Variables: Dependent: Job satisfaction Independent: Years of experience at two levels (high and low)
CAUSAL COMPARATIVE RESEARCH (continued) Example: Relationship between years of experience and job satisfaction Causal comparative research: Sample: Two groups sampled, one group high, one group low Data analysis: Mean job ratings for teachers from high experience group and low experience group Groups compared with t-tests or ANOVA Rejection of the null hypothesis supports the alternative that years of teaching experience results in increased job satisfaction
Experimental Research • One or more variables are systematically manipulated to see their effect (alone or in combination) on an outcome variable • Data will be able to be used to make statements about cause and effect • Effect of manipulation of the independent variable = treatment • Experimental control (internal validity) on a control group and experimental group ensures that differences between groups can confidently be attributed to the treatment
Experimental Research (continued) Types of experimental design: • True experiment Group 1 (experimental) treatment outcome Group 2 (control) no treatment outcome • Random assignment of members to groups • Example: Exposure to a memory programme to see the effects on recall • Variation: Solomon 4 group design with two more control groups
Experimental Research (continued) Types of experimental design: 2. Repeated measures Person 1: treatment 1, treatment 2 –treatment x, outcome Person 2: treatment 1, treatment 2, - treatment x, outcome Person n: treatment 1, treatment 2, - treatment x, outcome • Each person serves as his/her own control • Stronger design would involve random ordering of treatments to eliminate sequence effect • Example: Multimedia vs. text formats in memory recall
Experimental Research (continued) Types of experimental design: 3. Quasi experimental design Person 1: treatment outcome Person 2: no treatment outcome • No random assignment to groups • Groups already exist • Example: Two classes, computer assistance to one class, pre-testing before intervention to assure group equivalence
Experimental Research (continued) Types of experimental design: 4. Time series design Group 1: Obs 1, Obs 2, Obs 3, TreatmentObs 4, Obs 5, Obs 6 • Type of quasi experimentation, no random assignment to groups • Disadvantage: Improvement from pre-testing to post-testing due to treatment? Some element of caution, not a true experimental design!! • Example: One class, five consecutive days, computer-based instructional units with rewards for last two days
Experimental Research (continued) Types of experimental design: 5. Ex Post Facto • Type of quasi experimentation, no random assignment to groups • No manipulation of variables, no treatment • Existing groups who are self-selected are compared • Example: Preference for paper-and-pencil vs. computer notes • May look like an experiment, but closer related to correlational design • Only shows relationship between performance and computer typed notes, not the cause
Experimental Research (continued) Validity threats in Experimental design: • History: Events other than the treatment affect outcome • Maturation: Physical or psychological changes take place within subjects • Testing: Performance in pre-test affects outcomes of post-test • Instrumentation: Inconsistent instrument use or differences in degree of difficulty between pre- and post-test • Statistical regression: High and low achievers regress towards the mean during post-testing • Selection: Systematic difference in subjects’ abilities or characteristics between groups being compared • Experimental mortality: Loss of subjects • Diffusion of treatments: Implementation of treatment influences subjects in comparison group
Experimental Research (continued) • Experimental design • Causal group comparisons • Individuals randomly assigned to treatment groups • Independent variable manipulated by the researcher • Causal comparative • Group comparisons • Individuals already in groups before research begins • Independent variable not manipulated: • - Cannot • - Should not • - Is not
Survey Research • A research design that can utilise several basic research procedures to obtain information that can be generalised to the larger population • Types of information include: • Knowledge • Demographic information • Attitudes • Opinions • Behaviour
Research Methods • Questionnaires (self- or group administered) • To different respondents e.g. learners, teachers, school principals, parents of learners, district officials • Used to gauge attitudes and behaviour related to the topic of study • Assessment instruments to obtain an achievement score that quantifies ability, knowledge or skill • Observations that can be quantified • Example: The relationship between Maths performance at Grade 4 and nutritional status
Sample of Participants • Quantitative research, and specifically survey designs, always rely on representative samples. • Generalisations from sample to population = inductive reasoning, basis for the use of inferential statistics. • Disadvantage of quantitative research: • Expensive to collect data for 100+ respondents on your own • Advantage of quantitative research: • Use of secondary analysis on already existing large scale samples such as: • Progress in International Reading Literacy Study (PIRLS) 2006 and 2011 • Trends in International Maths and Science Study (TIMSS) 2011 • SACMEQ III and IV • DBE datasets, e.g. Grade 12 results, registry of needs, EMIS
Sampling Procedures • Nonprobability sampling • Respondents are not randomly selected, but selected with a specific purpose in mind • Examples are convenience, snowball, purposive, deviant case, quota • Probability sampling • Simple random sampling • Stratified random sampling
Sampling Procedure (continued) • Important steps: 1. Defining the population • Grade 4 learners in South Africa 2. Constructing a sampling frame from which to select • List of all primary schools that offer Grade 4 • From the sampling frame further selection is done in terms of: • Specific schools • Specific classes • Specific strata of interest
Survey Instruments • Quantitative research methods: • Questionnaires (self- or group administered) • Assessment instruments • Qualitative research methods: • Interviews (face-to-face or telephonic)
Data Collection • The physical administration of questionnaires, tests or conducting observations. • Pitfalls of data collection: • It always takes longer than anticipated • Denied access from DBE or unions • Non-responses or no returns of instruments • Poor communication between researcher and respondents • Technical problems with equipment • Cost of printing instruments, travel, subsistence • Poor instrument design and development
Data Analysis • Quantitative data analysed in one of two ways: • Descriptive statistics • Inferential statistics
Data Analysis (continued) • Descriptive statistics used to describe the data. • Descriptions of: • Sample (e.g. gender, age, qualification, school location) • Variables • Descriptive measures include: • Measures of central tendency (mean, median, mode) • Measures of dispersion (standard deviation, variance, minimum and maximum values, normality)
Data Analysis (continued) • Inferential statistics allow you to test for statistical significance: • Differences between groups: • T-test • ANOVA • Chi square • Relationships between variables • Factor analysis • Regression • Correlations
Methodological Norms • Data collection instruments have to adhere to: • Reliability • Are you measuring consistently? • Cronbach’s Alpha most widely used • Validity • Are you measuring what you are supposed to measure? • Face validity, construct validity, content validity