Download
1 / 13
140 likes | 881 Vues
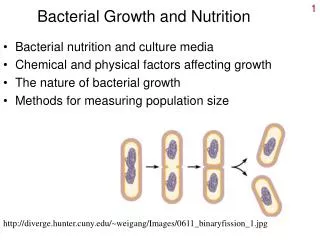
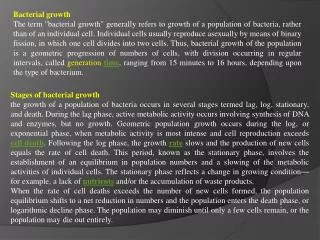
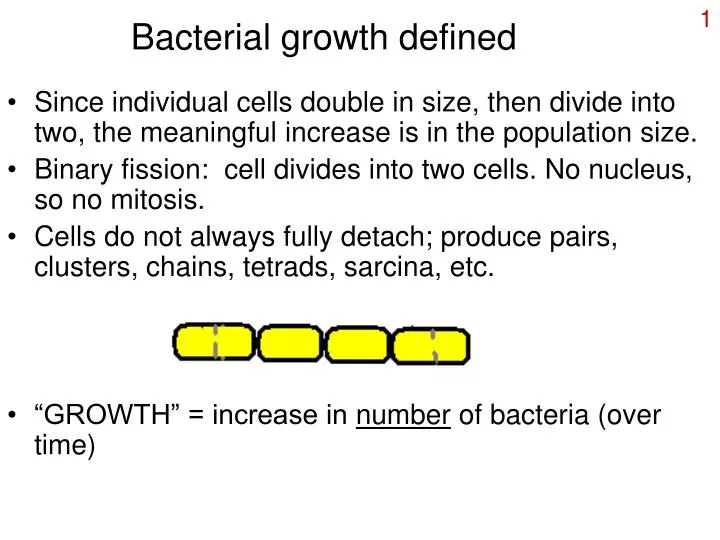
Bacterial growth defined. Since individual cells double in size, then divide into two, the meaningful increase is in the population size. Binary fission: cell divides into two cells. No nucleus, so no mitosis.

E N D
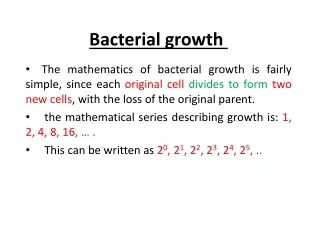
Bacterial growth defined • Since individual cells double in size, then divide into two, the meaningful increase is in the population size. • Binary fission: cell divides into two cells. No nucleus, so no mitosis. • Cells do not always fully detach; produce pairs, clusters, chains, tetrads, sarcina, etc. • “GROWTH” = increase in number of bacteria (over time)
Mathematics of bacterial growth • Because bacteria double in number at regular intervals, they grow exponentially: • N = N0 x 2n where N is the number of cells after n number of doublings and N0 is the starting number of cells. • Thus, a graph of the Log of the number of bacteria vs. time is a straight line.
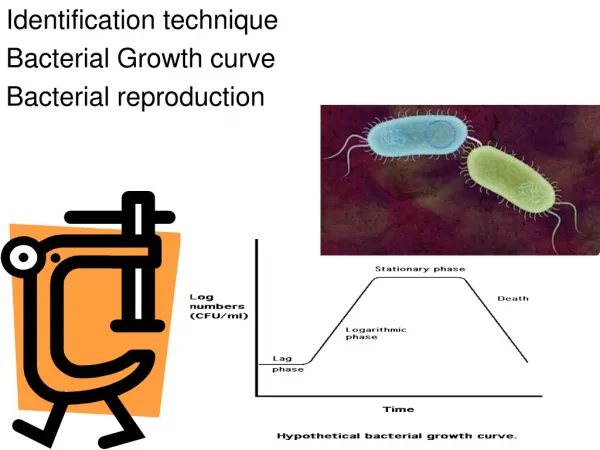
The Bacterial Growth Curve • Bacteria provided with an abundant supply of nutrients will increase in number exponentially, but eventually run out of nutrients or poison themselves with waste products. • Lag phase • Exponential or • Log phase • Stationary phase • Decline or Death • phase. 4 3 2 1
Growth curve (continued) • Lag phase: growth lags; cells are acclimating to the medium, creating ribosomes prior to rapid growth. • Log phase: cells doubling at regular intervals; linear graph when x-axis is logarithmic. • Stationary phase: no net increase in cell numbers, some divide, some die. Cells preparing for survival. • Decline phase: highly variable, depends on type of bacteria and conditions. Death may be slow and exponential.
More about Growth • The Growth curve is true under ideal conditions; in reality, bacteria are subject to starvation, competition, and rapidly changing conditions. • Generation time: the length of time it takes for the population to double. • Growth of bacteria is nonsynchronous, not every bacterium is dividing at the same time. • Instead of stepwise curve, smooth curve
Measurement of growth • Direct methods: cells actually counted. • Petroff-Hausser counting chamber (right), 3D grid. Count the cells, multiply by a conversion factor. • Dry a drop of cells of known volume, stain, then count. • Coulter-counter: single-file cells detected by change in electric current.
Coulter Counter Coulter-counter: single-file cells detected by change in electric current.
Measurement of growth -2 • Viable plate count • Relies on bacteria being alive, multiplying and forming colonies. • Spread plate: sample is spread on surface of agar. • Pour plate: sample is mixed with melted agar; colonies form on surface and within agar. • “Alive” means able to multiply. biology.clc.uc.edu/.../Meat_Milk/ Pour_Plate.htm
Filtration: • Membrane filters are very thin with a defined pore size, e.g. 0.45 µm. • Bacteria from a dilute sample are collected on a filter; filter placed on agar plate, colonies counted. http://dl.clackamas.cc.or.us/wqt111/coliform-8.jpg http://www.who.int/docstore/water_sanitation_health/labmanual/p25bs.jpg
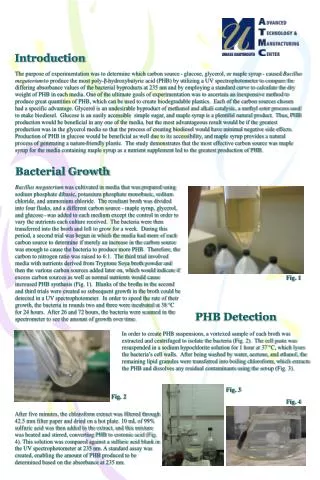
Spectrophotometry • Bacteria scatter light, making a turbid (cloudy) suspension. • Turbidity is usually read on the Absorbance scale • Not really absorbance, but Optical Density (OD) • More bacteria, greater the turbidity (measured as OD) Based on www.umr.edu/~gbert/ color/spec/Aspec.html
More about Spectrophotometry • Does NOT provide an actual number unless a calibration curve (# of bacteria vs. O.D.) is created. • Indirect counting method • Quick and convenient, shows relative change in the number of bacteria, useful for determining growth (increase in numbers). • Does NOT distinguish between live and dead cells. To create a calibration curve, best to plot OD vs. number of cells determined with microscope (not plate count).
Exponential growth • “Balanced growth” • Numbers of bacteria are doubling at regular intervals. • All components of bacteria are increasing in amount at the same rate • 2x as many bacteria = 2x as much protein, 2x as much peptidgolycan, 2x as much LPS, etc. • During exponential growth, bacteria are not limited for any nutrients, i.e. they are not short of anything.
Biomass: • Measure the total mass of cells or amount of any component such as protein, PS, DNA, KDO. • Especially when cells are doubling, the amounts of all the components of a cell are increasing at the same rate, so any could be measured. • Not so in stationary phase. In this example, total biomass increases exponentially over time. http://www.pubmedcentral.nih.gov/pagerender.fcgi?artid=242188&pageindex=10#page