Download
1 / 39
390 likes | 496 Vues
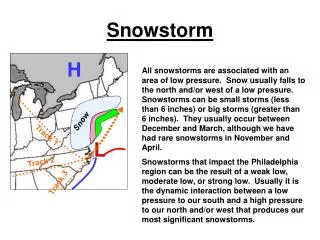
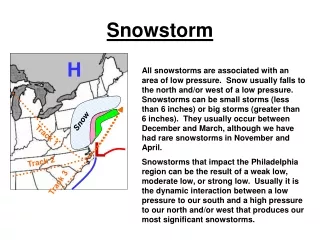
The Christmas Day Snowstorm of 2002. Meteorology 361 presentation. Highlights. • Oneonta measured 24” snowfall • Many reports of 30” + • Classic Nor’easter. Surface Map animation. Watch for:. • Low on stationary front near Gulf • Low develops and moves up Ohio valley

E N D
The Christmas Day Snowstorm of 2002 Meteorology 361 presentation
Highlights • Oneonta measured 24” snowfall • Many reports of 30” + • Classic Nor’easter
Surface Map animation Watch for: • Low on stationary front near Gulf • Low develops and moves up Ohio valley • Secondary low forms off East coast • Cold air damming
Features to notice in Satellite Loop • Large Cloud shield in south on Dec 23 • Clouds in Canada move independently • Cloud shield splits on Dec 24 • High cloud tops in southeast on Dec 24 • Coastal redevelopment on Dec 25 • Dry tongue becomes pronounced Dec 25
850 mb loop • Strong temperature gradient • Warm air wedge gets as far north as LI • Redevelopment of Low 12-18Z on Dec 25 • Strong deepening drives cold air south behind Low after 18Z on Dec 25 • Heaviest snow occurs just on cold side of temperature gradient
500 mb Vorticity Increases and splits as it crosses mountains and goes offshore Max of 38 x 10E-5 per second PVA offshore supports surface Low, not the heavy snow inland (Note: some Eta forecasts were used to fill in times between 00Z and 12Z)
Jet Streams • Split flow • Ridge in Polar westerlies supports cold air • Trough in Subtropical westerlies for Low • Powerful Subtropical Jets mean abundant humidity available • First Subtropical Jet supports initial Low in right rear quadrant • Second Subtropical jet supports redeveloped Low in left front gradrant
U.S. Radar Loop Features to notice: • Severe squall line in southeast • Initial Low dies in midwest • New echoes form east of Appalachians • Echo intensity in snow up to 50 dbz
Northeast Radar Loop Features to notice: • Largest area of strong echoes along coast • Mesoscale snowbands around 40 dbz in upstate NY
Eta 24 hour Forecast 00Z Dec 26, 2002
Eta 48 hour Forecast 00Z Dec 26, 2002
Eta 72 hour Forecast 00Z Dec 26, 2002
GFS 120 hour Forecast 00Z Dec 26, 2002
GFS 144 hour Forecast 00Z Dec 26, 2002
GFS 168 hour Forecast 00Z Dec 26, 2002
Conclusions • Low began near Gulf coast redeveloped off coast of N. Carolina • Classic Nor’easter north of Hatteras • With cold air in place, snow even at coast • Strong subtropical Jet and ageostrophic flow • Severe thunderstorms in warm sector • Mesoscale snowbands produce record amounts for interior New York • Eta forecasts out to 48 hours were excellent. GFS had an accurate forecast at 144 hours, but 168 hour forecast was poor.