Download
1 / 39
390 likes | 401 Vues
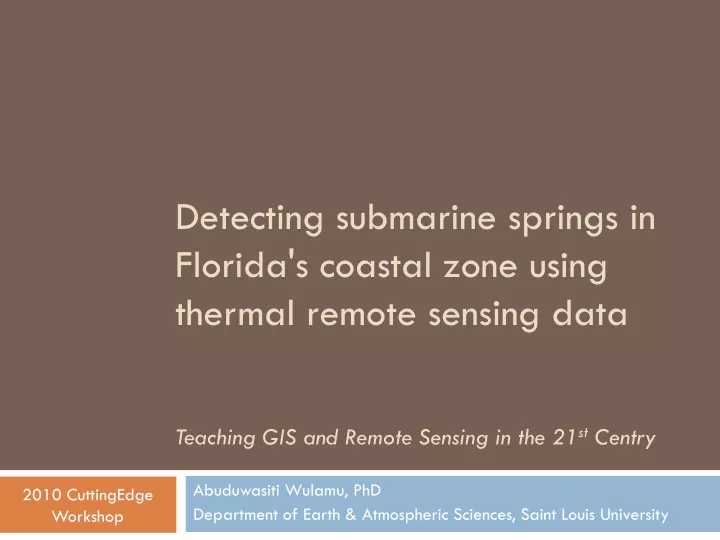
Detecting submarine springs in Florida's coastal zone using thermal remote sensing data Teaching GIS and Remote Sensing in the 21 st Centry. Abuduwasiti Wulamu , PhD Department of Earth & Atmospheric Sciences, Saint Louis University. Overview. Lab Description Objective Data

E N D
Detecting submarine springs in Florida's coastal zone using thermal remote sensing dataTeaching GIS and Remote Sensing in the 21st Centry AbuduwasitiWulamu, PhD Department of Earth & Atmospheric Sciences, Saint Louis University
Overview • Lab Description • Objective • Data • Retrieval of Surface temperature • Signatures of submarine springs from thermal anomaly • Conclusion • Acknowledgements
Course Settings • College Level 4XX • Geospatial Methods • Remote Sensing • Lab • Middle or end of semester • A class project or lab assignment
Lab Description • Objective • Familiarize students with thermal remote sensing with a practical example • Stimulate creative thinking skills • Data • Landsat ETM+ • Census dataset • Field collections
Study area Tallahassee, Florida
How to get the data Geovis.USGS.GOV
How to get the data Unzip the downloaded data
Retrieval of surface temperature Theoretical background
Thermal radiation http://en.wikipedia.org/
Radiometric Calibration DN Radiance • DN Radiance where the LMIN and LMAX are the spectral radiances for each band at digital numbers 1 and 255. DN is the pixel DN value, λ is the wavelength. One gets LMIN and LMAX values from the header file. http://landsathandbook.gsfc.nasa.gov/handbook/handbook_htmls/chapter11/chapter11.html
Radiometric Calibration Radiance Brightness temperature • Planck’s function Where, C1=1.19104356×10⁻¹⁶ W m2; C2=1.43876869×10⁻² m K
Radiometric Calibration Radiance Brightness temperature Let K1 = C1/λ5 , and K2 = C2/λ, and satellite measured radiant intensity B λ (T) = Lλ
Land Surface Temperature BTLST • λ is the wavelength of emitted radiance. λ = 11.5 μm (Markham and Barker, 1986) and ρ = h × c/σ = 14380 m K. Here, σ is Boltzmann constant (1.38 * 10−23 J/K), h is Planck’s constant (6.26 * 10−34 Js) and c is velocity of light (2.998 * 108 m/s). Artis and Carnahan, 1982. Survey of emissivity variability in thermography of urban areas, Rem. Sens. Environ.12 (1982), pp. 313–329.
Land surface temperature • BT LST • Radiative Transfer – MODTRAN • Quasi-physical models • JIMÉNEZ-MUÑOZ, J.C., SOBRINO, J.A. 2003. A generalized single-channel method for retrieving land surface temperature from remote sensing data. Journal of Geophysical Research, 108, doi: 10.1029/2003JD003480 • QIN, Z., KARNIELI, A., BERLINER, P. 2001. A mono-window algorithm for retrieving land surface temperature from Landsat TM data and its application to the Israel-Egypt border region. International Journal of Remote Sensing, 22, pp.3719-3746. • Srivastava, Majumdarand Bhattacharya. (2009).Surface temperature estimation in Singhbhum Shear Zone of India using Landsat-7 ETM+ thermal infrared data. Advances in Space Research, 431(10): 563-1574
Retrieval of surface temperature Implementing using ENVI
Implementing using ENVI Basic Tools Band Math DN Radiance ((12.650-3.200)/(255.0-1.0))*(B6-1.0)+3.200 Radiance Brightness Temperature 1282.71D/(alog(666.09D/B6+1D))
Implementing using ENVI File Open Image file
Implementing using ENVI Color compositing
Radiometric calibration Radiometric calibration DN at sensor temperature Basic Tools Preprocessing Calibration Utilities Landsat Calibration
ENVI Color Mapping Display Window Tools Color Mapping Envi Color Tables Select RainBow
GIS Visualization ArcGIS classification ENVI Color Mapping
Export to ArcGIS Save File As Save Image As Export to ArcMap
Export Image to ArcMap Save Image as Save File As
Save Image As Display Window Tools Color Mapping Envi Color Tables Select RainBow
Visualization Classification in ArcMap
Visualization From ENVI Color Mapping
Conclusion • Extensive field work, validation needed • Geologic controls, e.g., fractures, aquifers that channels groundwater to the oceans need to be indentified • Radar and Optical data fusion is helpful • As stated earlier, the objective of this lab is to teach students how to use thermal remote sensing, rather than presenting a “solid” scientific research
Acknowledgements & References • Locational information for the spring vents that were verified on the Taylor County coast provided by Tom Greenhalgh from Florida Geological Survey • Artis and Carnahan, 1982. Survey of emissivity variability in thermography of urban areas, Rem. Sens. Environ. 12 (1982), pp. 313–329. • JIMÉNEZ-MUÑOZ, J.C., SOBRINO, J.A. 2003. A generalized single-channel method for retrieving land surface temperature from remote sensing data. Journal of Geophysical Research, 108, doi: 10.1029/2003JD003480 • QIN, Z., KARNIELI, A., BERLINER, P. 2001. A mono-window algorithm for retrieving land surface temperature from Landsat TM data and its application to the Israel-Egypt border region. International Journal of Remote Sensing, 22, pp.3719-3746. • Srivastava, Majumdarand Bhattacharya. (2009).Surface temperature estimation in Singhbhum Shear Zone of India using Landsat-7 ETM+ thermal infrared data. Advances in Space Research, 431(10): 563-1574 • http://www.dep.state.fl.us/geology/programs/hydrogeology/springs/powerpoint/McClean.ppt • http://www.dep.state.fl.us/ • http://glovis.usgs.gov/