Download
1 / 2
20 likes | 157 Vues
Online Resource 1 Article title: ‘The interrelationship between the lower oxygen limit, chlorophyll fluorescence and the xanthophyll cycle in plants’ Journal name: Photosynthesis Research

E N D
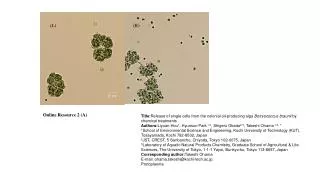
Online Resource 1 Article title: ‘The interrelationship between the lower oxygen limit, chlorophyll fluorescence and the xanthophyll cycle in plants’ Journal name: Photosynthesis Research Author names: A. Harrison Wright1,2*, John M. DeLong1, Arunika H.L.A.N. Gunawardena2, and Robert K. Prange1 1 Atlantic Food and Horticulture Research Centre, Agriculture and Agri-Food Canada, Kentville, NS, B4N 1J5, Canada. 2 Department of Biology, Dalhousie University, Halifax, NS, B3H 4J1, Canada Corresponding author email (*): harrison.wright@agr.gc.ca
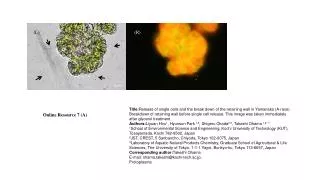
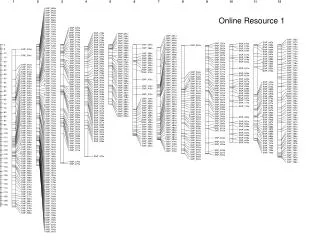
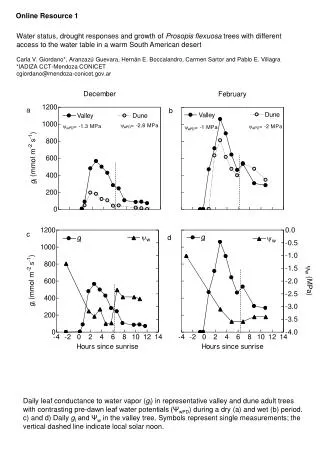
anaerobic compensation point extinction point extinction point Online Resource 1. Plots showing the response of minimum fluorescence (Fo) (solid line), CO2 and ethanol (EtOH) (dots) in apples (Malus domestica) to an incremental decline in O2 (dashed line)at 3.5 °C: (A) Honeycrisp, CO2; (B) Honeycrisp, EtOH; (C) Red Delicious, CO2; (D) Red Delicious, EtOH. The Fo shown is the averaged fluorescence value obtained from 4, 1 kg jars of fruit; the CO2 and EtOH values were also obtained from the same jars. In both cultivars the anaerobic compensation point (ACP) (i.e. the O2 level where the decrease in aerobic CO2 equals the increase in anaerobic CO2) occurred at the same time Fo began to increase (and did not return to baseline levels in the case of the red delicious). The extinction point (EP), described here as the first detection of EtOH, occurred at O2 levels well above the ACP (at normoxia in the case of the Honeycrisp apples). The Red Delicious fluorescence tended to acclimate to low-O2 while the Honeycrisp fluorescence values did not. Fo was measured every hour using a PFM fluorometer (i.e. Fα, an approximation of Fo)