Download
1 / 29
300 likes | 439 Vues
The Scientific Method. What is Science?. Science --organized way of using evidence to learn about the natural world Goals: Investigate and understand natural world to explain events. Use explanations to make useful predictions. Scientist Specialization . Biologists Ecologists

E N D
What is Science? • Science--organized way of using evidence to learn about the natural world • Goals: • Investigate and understand natural world to explain events. • Use explanations to make useful predictions
Scientist Specialization • Biologists • Ecologists • Population biologists • Zoologists • Cellular biologists • Molecular biologists Real Scientific Method Experiments of the Past
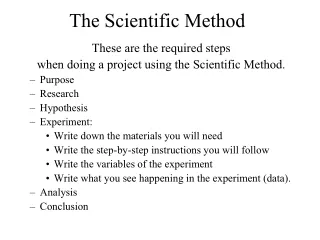
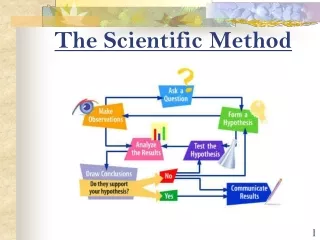
Scientific Method *OBSERVATION/QUESTION RESEARCH *HYPOTHESIS *EXPERIMENT *ANALYZE DATA/CONCLUSION
1. Observations and Questions • Use your senses to gather information of your surroundings • Inferencesare your logical interpretations of what you sense • Questions then arise……. Ex: Observe/ask why plants near my neighbors yard grow bigger than the others in my yard.
Research • Research question • Any previous experiments done? • Prior knowledge?
2. Hypothesis • Hypothesis-scientific and testableexplanation/solution to problem • “If [I do this]……then [this will happen]” Ex: IfI put fertilizer on my plants, then they will grow bigger
3. Experimental Procedure • Controlled experiments-designed to test only one factor at a time • Split subjects you are testing into groups: #1 Experimental Group-given the experimental factor or changed in some way #2 Control Group:-NOT changed Experimental Group Fertilizer Control Group No Fertilizer
Variable-factor in experiment that is subject to change. • Independentvariable- factor in experiment that you purposely manipulate Ex: fertilizer • Dependent variable- factor that you observe and that depends/changes in response to independent variable Ex: Plant height • Only test ONE independent variable while having many constants.
3. Experimental Procedure • Constant variables • Other variables involved that stay the same for experimental and control group • Ex: Same amount of water, same sunlight exposure, same kind of plants..etc
Must be a controlled, reproducible procedure Testing effects of only ONE manipulated Independent variable Other scientists need to be able to reproduce it and find same results.
4. Results • Record data • Qualitative data -physical traits (qualities) that can be described • Ex: Blue flower petals • Quantitative data -measurements (quantities) that can be taken • Ex: Plant measures 92cm tall • Utilize pictures, tables, graphs • Trends noticed?
Qualitative? Quantitative? Experimental Group Control Group fertilizer no fertilizer
5. Drawing Conclusions • Hypothesis is either supported or rejected. NEVER “PROVEN!” • If supported further testing • If rejected hypothesis changed and tested again • Can be partly true • Findings always useful!!! • Conclusion?
Findings always useful! “I didn’t fail 1000 times, the light bulb was an invention with 1000 steps” –Thomas Edison
Overview Section 1-2 State the Question or Problem Draw a Conclusion Form a Hypothesis Publish Results Set Up a Controlled Experiment Record Results
Scientific Theory • Theory-a well-supported explanation of some aspect of the natural world • It’s the closest you can get to scientific fact • It’s a hypothesis than has been tested and supported many times • Used to make future predictions • Not “a hunch” like it means in everyday language • If contradictory evidence found, theory revised • There is no evidence against them • A hypothesis is a POSSIBLE explanation, whereas a theory IS an explanation
Graphing • Graphs are a useful tool in science. • The visual characteristics of a graph make trends in data easy to see. • One of the most valuable uses for graphs is to "predict" data that is not measured on the graph.
Identify the Variables Determine the range Determine the scale Number and label each axis Plot the points Draw the graph Give your graph a title Graphing Steps
Identify the Variables • Independent Variable - (the thing you changed) • Goes on the X axis (horizontal) • Should be on the left side of a data table. • Dependent Variable - (changes with the independent variable) • Goes on the Y axis (vertical) • Should be on the right side of a data table.
Range • Subtract the lowest data value from the highest data value. • Do each variable separately.
Scale • Determine a scale,(the numerical value for each square),that best fits the range of each variable. • Spread the graph to use MOST of the available space.
Label Axis's • You need to tell everyone reading your graph what the graph means. • Be sure to include units.
Plotting • Plot each data value on the graph with a dot. You can put the data number by the dot, if it does not clutter your graph.
Drawing • Draw a curve or a line that best fits the data points. • Most graphs of experimental data are not drawn as "connect-the-dots".
Title • Your title should clearly tell what the graph is about. • If your graph has more than one set of data, provide a "key" to identify the different lines • While your high school teachers might not like it, I do like putting your name in the title of the graph. • Rachel and Max’s Sunspot Graph
Interpolate: predicting data between two measured points on the graph. Interpolation
Extrapolate: extending the graph, along the same slope, above or below measured data. Extrapolation