Download
1 / 43
480 likes | 859 Vues
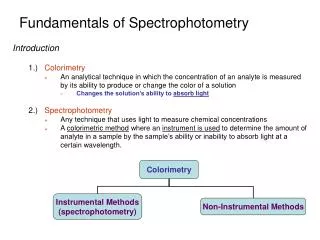
Fundamentals of Spectrophotometry. Introduction 1.) Colorimetry An analytical technique in which the concentration of an analyte is measured by its ability to produce or change the color of a solution Changes the solution’s ability to absorb light 2.) Spectrophotometry

E N D
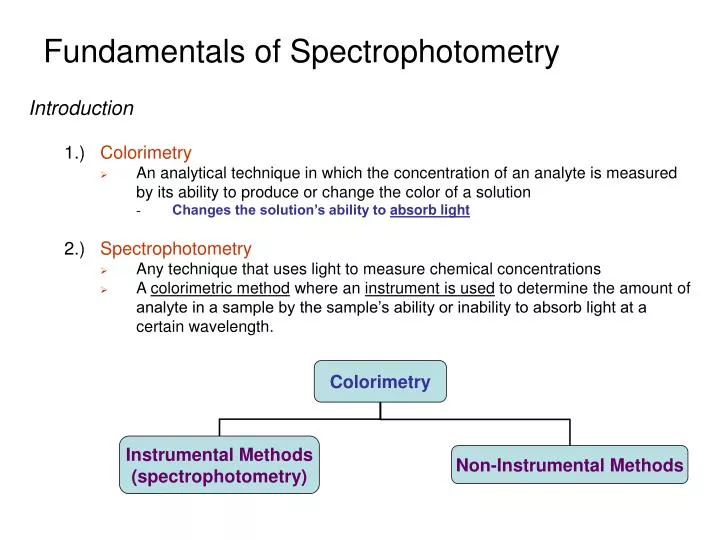
Fundamentals of Spectrophotometry • Introduction 1.) Colorimetry • An analytical technique in which the concentration of an analyte is measured by its ability to produce or change the color of a solution • Changes the solution’s ability to absorb light 2.) Spectrophotometry • Any technique that uses light to measure chemical concentrations • A colorimetric method where an instrument is used to determine the amount of analyte in a sample by the sample’s ability or inability to absorb light at a certain wavelength. Colorimetry Instrumental Methods (spectrophotometry) Non-Instrumental Methods
Fundamentals of Spectrophotometry • Introduction 3.) Illustration • Measurement of Ozone (O3) Above South Pole • O3 provides protection from ultraviolet radiation • Seasonal depletion due to chlorofluorocarbons O3 cycle Chain Reaction Depletion of O3 Spectra analysis of [O3]
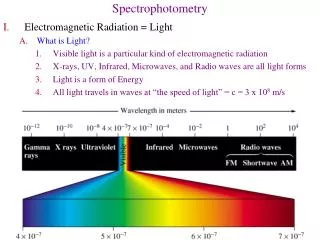
Fundamentals of Spectrophotometry • Properties of Light 1.) Particles and Waves • Light waves consist of perpendicular, oscillating electric and magnetic fields • Parameters used to describe light • amplitude (A):height of wave’s electric vector • Wavelength (l): distance (nm, cm, m) from peak to peak • Frequency (n): number of complete oscillations that the waves makes each second • Hertz (Hz): unit of frequency, second-1 (s-1) • 1 megahertz (MHz) = 106s-1 = 106Hz
Fundamentals of Spectrophotometry • Properties of Light 1.) Particles and Waves • Parameters used to describe light • Energy (E): the energy of one particle of light (photon) is proportional to its frequency where: E = photon energy (Joules) n = frequency (sec-1) h = Planck’s constant (6.626x10⁻³⁴J-s) As frequency (n) increases, energy (E) of light increases
Fundamentals of Spectrophotometry • Properties of Light 1.) Particles and Waves • Relationship between Frequency and Wavelength • Relationship between Energy and Wavelength where: c = speed of light (3.0x10⁸ m/s in vacuum)) n = frequency (sec-1) l = wavelength (m) where: = (1/l) = wavenumber As frequency (l) decreases, energy (E) of light increases
Fundamentals of Spectrophotometry • Properties of Light 2.) Types of Light – The Electromagnetic Spectrum • Note again, energy (E) of light increase as frequency (n) increases or wavelength (l) decreases
Fundamentals of Spectrophotometry • Properties of Light 2.) Types of Light – The Electromagnetic Spectrum
Fundamentals of Spectrophotometry • Absorption of Light 1.) Colors of Visible Light • Many Types of Chemicals Absorb Various Forms of Light • The Color of Light Absorbed and Observed passing through the Compound are Complimentary
Fundamentals of Spectrophotometry • Absorption of Light 2.) Ground and Excited State • When a chemical absorbs light, it goes from a low energy state (ground state) to a higher energy state (excited state) • Only photons with energies exactly equal to the energy difference between the two electron states will be absorbed • Since different chemicals have different electron shells which are filled, they will each absorb their own particular type of light • Different electron ground states and excited states Energy required of photon to give this transition: DE = E1 - Eo
Fundamentals of Spectrophotometry • Absorption of Light 3.) Beer’s Law • The relative amount of a certain wavelength of light absorbed (A) that passes through a sample is dependent on: • distance the light must pass through the sample (cell path length - b) • amount of absorbing chemicals in the sample (analyte concentration – c) • ability of the sample to absorb light (molar absorptivity - e) Increasing [Fe2+] Absorbance is directly proportional to concentration of Fe+2
Fundamentals of Spectrophotometry • Absorption of Light 3.) Beer’s Law • The relative amount of light making it through the sample (P/Po) is known as the transmittance (T) Percent transmittance T has a range of 0 to 1, %T has a range of 0 to 100%
Fundamentals of Spectrophotometry • Absorption of Light 3.) Beer’s Law • Absorbance (A) is the relative amount of light absorbed by the sample and is related to transmittance (T) • Absorbance is sometimes called optical density (OD) A has a range of 0 to infinity
Fundamentals of Spectrophotometry • Absorption of Light 3.) Beer’s Law • Absorbance is useful since it is directly related to the analyte concentration, cell pathlength and molar absorptivity. • This relationship is known as Beer’s Law where: A = absorbance (no units) e = molar absorptivity (L/mole-cm) b = cell pathlength (cm) c = concentration of analyte (mol/L) Beer’s Law allows compounds to be quantified by their ability to absorb light, Relates directly to concentration (c)
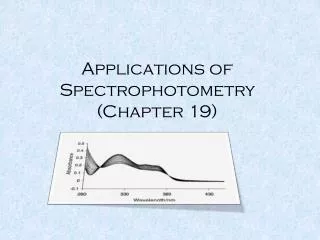
Fundamentals of Spectrophotometry • Absorption of Light 4.) Absorption Spectrum • Different chemicals have different energy levels • different ground vs. excited electron states • will have different abilities to absorb light at any given wavelength • Absorption Spectrum – plot of absorbance (or e) vs. wavelength for a compound • The greater the absorbance of a compound at a given wavelength (high e), the easier it will be to detect at low concentrations
Fundamentals of Spectrophotometry • Absorption of Light 4.) Absorption Spectrum • By choosing different wavelengths of light (lA vs. lB) different compounds can be measured lA lB
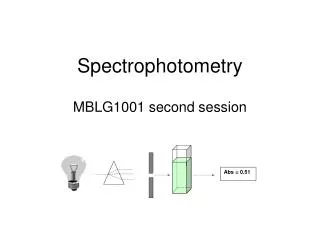
Fundamentals of Spectrophotometry • Spectrophotometer 1.) Basic Design • An instrument used to make absorbance or transmittance measurements is known as a spectrophotometer
Fundamentals of Spectrophotometry • Spectrophotometer 1.) Basic Design • Light Source: provides the light to be passed through the sample • Tungsten Lamp: visible light (320-2500 nm) • Deuterium Lamp: ultraviolet Light (160-375 nm) • - based on black body radiation: • heat solid filament to glowing, light emitted will be characteristic of temperature more than nature of solid filament Low pressure (vacuum) Tungsten Filament In presence of arc, some of the electrical energy is absorbed by D2 (or H2) which results in the disassociation of the gas and release of light D2 + Eelect D*2 D’ + D’’ + hn (light produced) Excited state
Fundamentals of Spectrophotometry • Spectrophotometer 1.) Basic Design • Wavelength Selector (monochromator): used to select a given wavelength of light from the light source • Prism: • Filter:
Fundamentals of Spectrophotometry • Spectrophotometer 1.) Basic Design • Wavelength Selector (monochromator): used to select a given wavelength of light from the light source • Reflection or Diffraction Grating:
Fundamentals of Spectrophotometry • Spectrophotometer 1.) Basic Design • Sample Cell: sample container of fixed length (b). • Usually round or square cuvet • Made of material that does not absorb light in the wavelength range of interest • Glass – visible region • Quartz – ultraviolet • NaCl, KBr – Infrared region
Fundamentals of Spectrophotometry • Spectrophotometer 1.) Basic Design • Light Detector: measures the amount of light passing through the sample. • Usually works by converting light signal into electrical signal Process: a)light hits photoemissive cathode and e- is emitted. b) an emitted e- is attracted to electrode #1 (dynode 1), which is 90V more positive. Causes several more e- to be emitted. c)these e- are attracted to dynode 2, which is 90V more positive then dynode 1, emitting more e-. d) process continues until e- are collected at anode after amplification at 9 dynodes. e) overall voltage between anode and cathode is 900V. f) one photon produces 106 – 107 electrons. g) current is amplified and measured Photomultiplier tube
Fundamentals of Spectrophotometry • Spectrophotometer 2.) Types of Spectrophotometers • Single-Beam Instrument: sample and blank are alternatively measured in same sample chamber.
Fundamentals of Spectrophotometry • Spectrophotometer 2.) Types of Spectrophotometers • Double-Beam Instrument • Continuously compares sample and blank • Automatically corrects for changes in electronic signal or light intensity of source
Fundamentals of Spectrophotometry • Chemical Analysis 1.) Calibration • To measure the absorbance of a sample, it is necessary to measure Po and P ratio • Po – the amount of light passing through the system with no sample present • P – the intensity of light when the sample is present • Po is measured with a blank cuvet • Cuvet contains all components in the sample solution except the analyte of interest • P is measured by placing the sample in the cuvet. • To accurately measure an unknown concentration, obtain a calibration curve using a range of known concentrations for the analyte
Fundamentals of Spectrophotometry • Chemical Analysis 2.) Limitations in Beer’s Law • Results in non-linear calibration curve • At high concentrations, solute molecules influence one another because of their proximity • Molar absorptivity changes • Affect on equilibrium, (HA and A- have difference absorption) • Analyte properties change in different solvents • Errors in reproducible positioning of cuvet • Also problems with dirt & fingerprints • Instrument electrical noise Keep A in range of 0.1 – 1.5 absorbance units (80 -3%T)
Fundamentals of Spectrophotometry • Chemical Analysis 3.) Precautions in Quantitative Absorbance Measurements • Choice of Wavelength • Choose a wavelength at an absorption maximum • Minimizes deviations from Beer’s law, which assumes e is constant • Pick peak in absorption spectrum where analyte is only compound absorbing light • Or choose a wavelength where the analyte has the largest difference in its absorbance relative to other sample components Bad choice for either compound (a) or (b) Best choice compound (b) Best choice compound (a)
Fundamentals of Spectrophotometry • Chemical Analysis 4.) Example: A 3.96x10⁻⁴ M solution of compound A exhibited an absorbance of 0.624 at 238 nm in a 1.000 cm cuvet. A blank had an absorbance of 0.029. The absorbance of an unknown solution of compound A was 0.375. Find the concentration of A in the unknown.
Fundamentals of Spectrophotometry • What Happens When a Molecule Absorbs Light? 1.) Molecule Promoted to a More Energetic Excited State • Absorption of UV-vis light results in an electron promoted to a higher energy molecular orbital • s s* transition in vacuum UV • n s* saturated compounds with non-bonding electrons • n p*, p p* requires unsaturated functional groups (eq. double bonds) • most commonly used, energy good range for UV/Vis
Fundamentals of Spectrophotometry • What Happens When a Molecule Absorbs Light? 1.) Molecule Promoted to a More Energetic Excited State • Geometrical Structure of the Excited State will Differ from the Ground State Ground State Excitation of an electron to the pi antibondingorbital (p*) in formaldehyde produces repulsion instead of attraction between the carbon and oxygen atom Excited State
Fundamentals of Spectrophotometry • What Happens When a Molecule Absorbs Light? 1.) Molecule Promoted to a More Energetic Excited State • Two Possible Transitions in Excited State • Single state – electron spins opposed • Triplet state – electron spins are parallel • In general, triplet state has lower energy than singlet state • Singlet to Triplet transition has a very low probability • Singlet to Singlet Transition are more probable
Fundamentals of Spectrophotometry • What Happens When a Molecule Absorbs Light? 2.) Infrared and Microwave Radiation • Not energetic enough to induce electronic transition • Change vibrational, translational and rotational motion of the molecule • The entire molecule and each atom can move along the x, y, z-axis • When correct wavelength is absorbed, • Oscillations of the atom vibration is increased in amplitude • Molecule rotates or moves (translation) faster Vibrational States of Formaldehyde Energy: Electronic >> Vibrational > Rotational
symmetric asymmetric In-plane scissoring Out-of-plane wagging Out-of-plane twisting In-plane rocking
Fundamentals of Spectrophotometry • What Happens When a Molecule Absorbs Light? 3.) Combined Electronic, Vibrational and Rotational Transitions • Absorption of photon with sufficient energy to excite an electron will also cause vibrational and rotational transitions • There are multiple vibrational and rotational energy levels associated with each electronic state • Excited vibrational and rotational states are lower energy than electronic state • Therefore, transition between electronic states can occur between different vibrational and rotational states Vibrational and rotational states associated with an electronic state
Fundamentals of Spectrophotometry • What Happens When a Molecule Absorbs Light? 4.) Relaxation Processes from Excited State • There are multiple possible relaxation pathways • Vibrational, Rotational relaxation occurs through collision with solvent or other molecules • energy is converted to heat (radiationless transition) • Electronic relaxation occurs through the release of a photon (light)
Fundamentals of Spectrophotometry • What Happens When a Molecule Absorbs Light? 4.) Relaxation Processes from Excited State • Internal conversion – transition between singlet electronic states through overlapping vibrational states • Intersystem crossing – transition between a singlet electronic state to a triplet electronic state by overlapping vibrational states
Fundamentals of Spectrophotometry • What Happens When a Molecule Absorbs Light? 4.) Relaxation Processes from Excited State • Fluorescence – emitting a photon by relaxing from an excited singlet electronic states to a ground singlet state S1 So • Phosphorescence – emitting a photon by relaxing from an excited tripletelectronic states to a ground singlet state T1 So
Fundamentals of Spectrophotometry • What Happens When a Molecule Absorbs Light? 5.) Fluorescence and Phosphorescence • Relative rates of relaxation depends on the molecule, the solvent, temperature, pressure, etc. • Energy of Phosphorescence is less than the energy of fluorescence • Phosphorescence occurs at a longer wavelengths than fluorescence • Lifetime of Fluorescence (10-8 to 10-4 s) is very short compared to phosphorescence (10-4 to 102 s) • Fluorescence and phosphorescence are relatively rare
Fundamentals of Spectrophotometry • What Happens When a Molecule Absorbs Light? 5.) Fluorescence and Phosphorescence • Fluorescence and phosphorescence come at lower energy than absorbance • Emission spectrum is roughly mirror image of absorption spectrum Color Change Due to Fluorescence at Higher Wavelength
Fundamentals of Spectrophotometry What Happens When a Molecule Absorbs Light? 5.) Fluorescence and Phosphorescence • Emission spectrum are of lower energy or higher wavelength because of the efficiency of vibrational relaxation • Absorption to an excited vibrational state will relax quickly to a ground vibrational state before the electronic relaxation
Fundamentals of Spectrophotometry • What Happens When a Molecule Absorbs Light? 5.) Fluorescence and Phosphorescence • Also, differences in stability of excited and ground state structure contribute to energy difference
Fundamentals of Spectrophotometry • Chemical Analysis 1.) Excitation and Emission Spectra Emission Spectra – measure fluorescence or phosphorescence over a range of wavelengths using a fixed varying excitation wavelength. Excitation Spectra – measure fluorescence or phosphorescence at a fixed wavelength while varying the excitation wavelength.
Fundamentals of Spectrophotometry • Chemical Analysis 2.) Fluorescence and Phosphorescence Intensity • At low concentration, emission intensity is proportional to analyte concentration • Related to Beer’s law • At high concentrations, deviation from linearity occurs • Emission decreases because absorption increases more rapidly • Emission is quenched absorption of excitation or emission energy by analyte molecules in solution where: k = constant Po = light intensity c = concentration of analyte (mol/L)
Fundamentals of Spectrophotometry • Chemical Analysis 3.) Example In formaldehyde, the transition n p*(T1) occurs at 397 nm, and the np*(S1) transition comes at 355 nm. What is the difference in energy (kJ/mol) between the S1 and T1 states?