Download
1 / 1
10 likes | 114 Vues
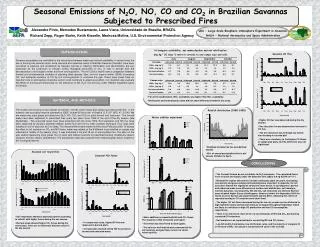
Decrease in CO 2 emissions related to increase in the iron level of Brazilian soils N. La Scala Jr. * , J. Marques Júnior, C. V. Santos, G. T. Pereira FCAV-UNESP, Via de acesso Prof. Paulo Donato Castellane s/n. 14870-000 - Jaboticabal, SP, Brazil

E N D
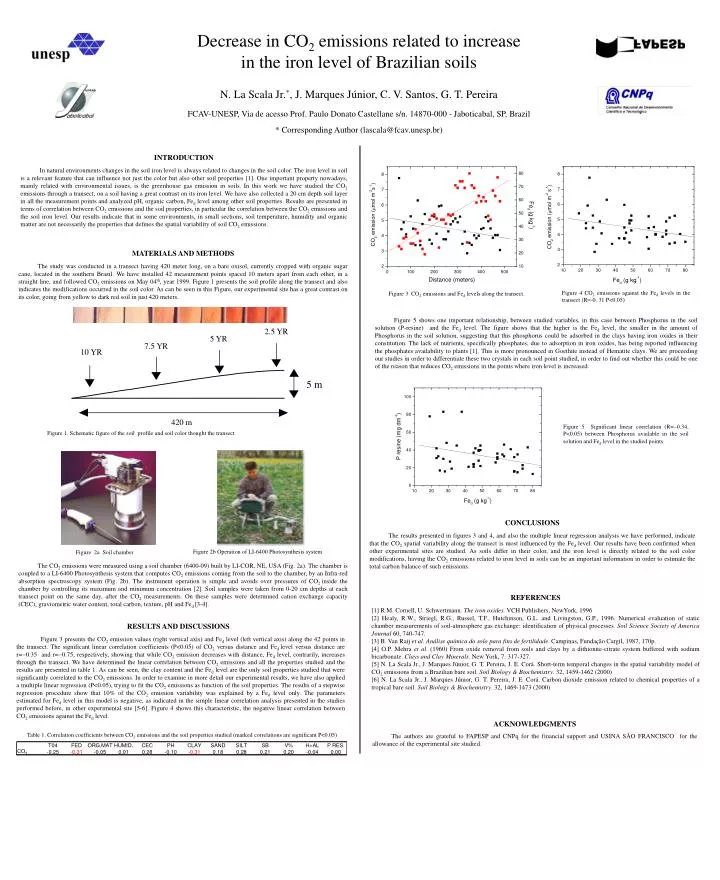
Decrease in CO2 emissions related to increase in the iron level of Brazilian soils N. La Scala Jr.*, J. Marques Júnior, C. V. Santos, G. T. Pereira FCAV-UNESP, Via de acesso Prof. Paulo Donato Castellane s/n. 14870-000 - Jaboticabal, SP, Brazil * Corresponding Author (lascala@fcav.unesp.br) INTRODUCTION In natural environments changes in the soil iron level is always related to changes in the soil color. The iron level in soil is a relevant feature that can influence not just the color but also other soil properties [1]. One important property nowadays, mainly related with environmental issues, is the greenhouse gas emission in soils. In this work we have studied the CO2 emissions through a transect, on a soil having a great contrast on its iron level. We have also collected a 20 cm depth soil layer in all the measurement points and analyzed pH, organic carbon, Fed level among other soil properties. Results are presented in terms of correlation between CO2 emissions and the soil properties, in particular the correlation between the CO2 emissions and the soil iron level. Our results indicate that in some environments, in small sections, soil temperature, humidity and organic matter are not necessarily the properties that defines the spatial variability of soil CO2 emissions. MATERIALS AND METHODS The study was conducted in a transect having 420 meter long, on a bare oxisol, currently cropped with organic sugar cane, located in the southern Brazil. We have installed 42 measurement points spaced 10 meters apart from each other, in a straight line, and followed CO2 emissions on May 04th, year 1999. Figure 1 presents the soil profile along the transect and also indicates the modifications occurred in the soil color. As can be seen in this Figure, our experimental site has a great contrast on its color, going from yellow to dark red soil in just 420 meters. The CO2 emissions were measured using a soil chamber (6400-09) built by LI-COR, NE, USA (Fig. 2a). The chamber is coupled to a LI-6400 Photosynthesis system that computes CO2 emissions coming from the soil to the chamber, by an Infra-red absorption spectroscopy system (Fig. 2b). The instrument operation is simple and avoids over pressures of CO2 inside the chamber by controlling its maximum and minimum concentration [2]. Soil samples were taken from 0-20 cm depths at each transect point on the same day, after the CO2 measurements. On these samples were determined cation exchange capacity (CEC), graviometric water content, total carbon, texture, pH and Fed[3-4]. Figure 4 CO2 emissions against the Fed levels in the transect (R=-0..31 P<0.05) Figure 3 CO2 emissions and Fed levels along the transect. Figure 5 shows one important relationship, between studied variables, in this case between Phosphorus in the soil solution (P-resine) and the Fed level. The figure shows that the higher is the Fed level, the smaller in the amount of Phosphorus in the soil solution, suggesting that this phosphorus could be adsorbed in the clays having iron oxides in their constitution. The lack of nutrients, specifically phosphates, due to adsorption in iron oxides, has being reported influencing the phosphates availability to plants [1]. This is more pronounced in Goethite instead of Hematite clays. We are proceeding our studies in order to differentiate these two crystals in each soil point studied, in order to find out whether this could be one of the reason that reduces CO2 emissions in the points where iron level is increased. 2.5 YR 5 YR 7.5 YR 10 YR 5 m 420 m Figure 5 Significant linear correlation (R=0.34, P<0.05) between Phosphorus available in the soil solution and Fed level in the studied points. Figure 1. Schematic figure of the soil profile and soil color thought the transect CONCLUSIONS The results presented in figures 3 and 4, and also the multiple linear regression analysis we have performed, indicate that the CO2 spatial variability along the transect is most influenced by the Fed level. Our results have been confirmed when other experimental sites are studied. As soils differ in their color, and the iron level is directly related to the soil color modifications, having the CO2 emissions related to iron level in soils can be an important information in order to estimate the total carbon balance of such emissions. Figure 2b Operation of LI-6400 Photosynthesis system Figure 2a Soil chamber REFERENCES [1] R.M. Cornell, U. Schwertmann. The iron oxides. VCH Publishers, NewYork, 1996 [2] Healy, R.W., Striegl, R.G., Russel, T.F., Hutchinson, G.L. and Livingston, G.P., 1996. Numerical evaluation of static chamber measurements of soil-atmosphere gas exchange: identification of physical processes. Soil Science Society of America Journal 60, 740-747. [3] B. Van Raij et al. Análise química do solo para fins de fertilidade. Campinas, Fundação Cargil, 1987, 170p. [4] O.P. Mehra et al. (1960) From oxide removal from soils and clays by a dithionite-citrate system buffered with sodium bicarbonate. Clays and Clay Minerals. New York, 7: 317-327. [5] N. La Scala Jr., J. Marques Júnior, G. T. Pereira, J. E. Corá. Short-term temporal changes in the spatial variability model of CO2 emissions from a Brazilian bare soil. Soil Biology & Biochemistry. 32, 1459-1462 (2000) [6] N. La Scala Jr., J. Marques Júnior, G. T. Pereira, J. E. Corá. Carbon dioxide emission related to chemical properties of a tropical bare soil. Soil Biology & Biochemistry. 32, 1469-1473 (2000) RESULTS AND DISCUSSIONS Figure 3 presents the CO2 emission values (right vertical axis) and Fed level (left vertical axis) along the 42 points in the transect. The significant linear correlation coefficients (P<0.05) of CO2 versus distance and Fed level versus distance are r=0.35 and r=0.75, respectively, showing that while CO2 emission decreases with distance, Fed level, contrarily, increases through the transect. We have determined the linear correlation between CO2 emissions and all the properties studied and the results are presented in table 1. As can be seen, the clay content and the Fed level are the only soil properties studied that were significantly correlated to the CO2 emissions. In order to examine in more detail our experimental results, we have also applied a multiple linear regression (P<0.05), trying to fit the CO2 emissions as function of the soil properties. The results of a stepwise regression procedure show that 10% of the CO2 emission variability was explained by a Fed level only. The parameters estimated for Fed level in this model is negative, as indicated in the simple linear correlation analysis presented in the studies performed before, in other experimental site [5-6]. Figure 4 shows this characteristic, the negative linear correlation between CO2 emissions against the Fed level. ACKNOWLEDGMENTS The authors are grateful to FAPESP and CNPq for the financial support and USINA SÃO FRANCISCO for the allowance of the experimental site studied. Table 1. Correlation coefficients between CO2 emissions and the soil properties studied (marked correlations are significant P<0.05)