Download
1 / 9
90 likes | 233 Vues
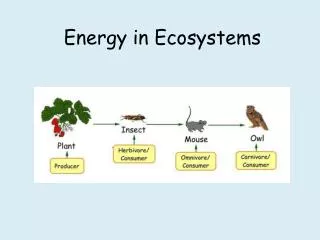
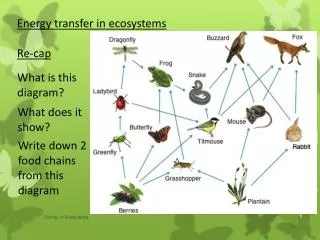
Energy transfer in ecosystems Re-cap. Draw a food chain. What does it show?. How much energy is lost between each organism?. How much energy is past on at each level?. Today we are learning about: The different ways to represent organisms in a food c hain. These include pyramids of:

E N D
Energy transfer in ecosystems Re-cap • Draw a food chain • What does it show? • How much energy is lost between each organism? • How much energy is past on at each level? Energy in Ecosystems
Today we are learning about: • The different ways to represent organisms in a food • chain. • These include pyramids of: • Numbers • Biomass • Energy • Success criteria • Name the 3 alternative ways to express food chains. • Explain what they mean. • Explain why biomass and energy are more useful • than numbers to represent food chains. Energy in Ecosystems
Pyramid of numbers This represents the organisms in a food chain by the number at each level. • Numbers decrease because each level can support less than the one before. Energy in Ecosystems
Exceptions to the usual shape are when the first organism in a food chain is a bush or tree e.g. Oak tree insect woodpecker • One Oak tree can • support many organisms in a • community. Energy in Ecosystems
Pyramid of biomass This represents the organisms in a food chain as the mass of living material (biomass) in each level. • The mass decreases • up the pyramid • Mass at each level • is measured in g/m2 Energy in Ecosystems
Pyramid of biomass In living food chains biomass is often only a representative estimate. This is because the best method of getting mass is to use dry mass. This would kill the organisms. Dry mass is more valid and accurate than wet mass as water content fluctuates widely. Energy in Ecosystems
Pyramid of energy • This represents the organisms in a food chain by the energy transferred from each level. Energy in Ecosystems
Pyramids of energy are always true pyramids. They give a better representation of a food chain as they are the energy passed on through the chain • Energy decreases because each level only passes on about 10%. It is measured in KJ/m2/year Decomposers and energy Energy is also used by decomposers for respiration. They break down dead organisms and waste (e.g. faeces) at each level. Energy in Ecosystems
What have we learned? What are the ways to represent food chains? • Explain what each of them mean • Why is the pyramid of energy the truest form to • represent the food chain? Energy in Ecosystems