Download
1 / 60
610 likes | 900 Vues
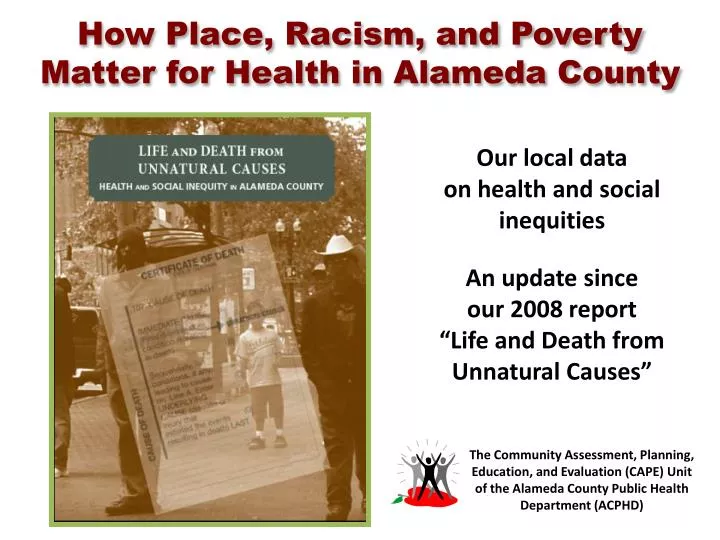
How Place, Racism, and Poverty Matter for Health in Alameda County. Our local data on health and social inequities. An update since our 2008 report “Life and Death from Unnatural Causes”.

E N D
How Place, Racism, and Poverty Matter for Health in Alameda County Our local data on health and social inequities An update since our 2008 report“Life and Death from Unnatural Causes” The Community Assessment, Planning, Education, and Evaluation (CAPE) Unit of the Alameda County Public Health Department (ACPHD)
Our Vision of Health Equity Everyone in Alameda County – no matter who you are, where you live, how much money you make, or the color of your skin – has opportunities to lead a healthy, fulfilling, and productive life.
Purpose of this Presentation To walk you through our latest data on health and social inequities in Alameda County and our interpretations of the data so you can: Increase understanding of what factors need to be addressed to improve opportunities for health throughout our County Use the data in your work to advance health and social equity Spark critical dialogue and collective thinking about solutions • Possible Uses for Data • Writing a grant where you must establish need • Advocating for change in particular neighborhood conditions • Using a health equity lens to frame a social or policy issue • Assessing whether your current program or policy work is helping to improve health equity • Talking with somebody who doesn’t understand how place, racism, and neighborhood poverty matter for health in our County
Health Inequities by Place Life Expectancy by Census Tract
Life Expectancy in Oakland by Region Just a few miles = Over a decade difference in LE
Compared to a White child born in the affluent Oakland Hills… 71 O WEST OAKLANDLIFE EXPECTANCY O 85 OAKLAND HILLSLIFE EXPECTANCY …an African American child born in West Oakland can expect to live 14 fewer years. Source: Alameda County Vital Statistics files, 2010-2012 Photo Source: The California Endowment, Health Happens Here
Why Does Place Matter for Health? Communities of Opportunity Disinvested Communities • Parks • Safe/Walkable Streets • Grocery Stores and Healthy Foods • Good Schools • Clean Air • Quality Housing • Public Transportation • Good Jobs • Strong Local Businesses • Financial Institutions • Limited/Unsafe Parks • Crime • Fast Food Restaurants • Liquor Stores • Poor Performing Schools • Pollution and Toxic Exposures • Transportation Barriers • Absence of High Quality Financial Institutions • Predatory Lenders Good Health Status Poor Health Status
Key Determinants of Health Inequity STRUCTURAL RACISM Inequitable Economic Conditions Poor and Inequitable Health Outcomes in Low-Income Communities of Color Concentrated and Persistent Poverty Inequitable Psycho-Social Conditions Racial Residential Segregation Inequitable Built Environment Conditions
Historical Roots of Racial Residential Segregation and Persistent Poverty Discriminatory mortgage underwriting by the FHA/VA Disinvestment andconcentrated poverty in urban centers Redlining practicesby banks and homeinsurance agents Middle class and white flight to the suburbs Racial steeringand block-busting practices by real estate agents Displacement caused by federal highway construction and other urban renewal projects
Concentrated and Persistent Poverty Poor and Inequitable Health Outcomes in Low-Income Communities of Color
Definitions of Poverty Individual Poverty, 2013 € A single person living alone has a household income of less than $11,490 A family of four has a household income of less than $23,550 € € € € Neighborhood Poverty Defined by the percentage of residents living in poverty 30%+ are living in poverty Very High Poverty 20-29.9% are living in poverty High Poverty <10% are living in poverty Affluent
Neighborhood Poverty Level by Census Tract Very high poverty neighborhoods High poverty neighborhoods Affluent neighborhoods
Definitions of Poverty (continued) Persistent Neighborhood Poverty Defined by the number of decades of high neighborhood poverty Neighborhood with high poverty for 5 decades (1970-2010) Persistent High Poverty Neighborhood with high poverty for 3-4 decades Frequent High Poverty Neighborhood with high poverty for 2 decades Intermittent High Poverty Neighborhood with high poverty for 1 decade Infrequent High Poverty Neighborhood with high poverty for 0 decades No High Poverty
Life Expectancy by Neighborhood Poverty Level:A Social Gradient in Health 7 year difference in life expectancy (Affluent) (Very High Poverty) Source: Alameda County Vital Statistics files, 2008-2010
5 Leading Causes of Death in Alameda County, 2008-2010 Top 5 account for 62% of total deaths Source: Alameda County Vital Statistics files, 2008-2010
5 Leading Causes of Death by Neighborhood Poverty Level, 2000-2010 Source: Alameda County Vital Statistics files, 2008-2010
Social Gradients in Mortality Neighborhood Poverty Level (Affluent) (Very High Poverty) Source: Alameda County Vital Statistics files, 2008-2010
Social Gradients in Morbidity Neighborhood Poverty Level (Affluent) (High Poverty) *ED rates and neighborhood poverty are at the zip code level Source: Alameda County OSHPD files, 2009-2011
Neighborhood Poverty Impacts Health Over the Life Course (Very High Poverty Neighborhoods) (Affluent Neighborhoods) Source: Alameda County Vital Statistics files, 2006-2010
Leading Causes of Death by Age Groupin Very High Poverty Neighborhoods 81% of deaths 65% of deaths 60% of deaths Source: Alameda County Vital Statistics files, 2006-2010
Poor and Inequitable Health Outcomes in Low-Income Communities of Color Racial Residential Segregation
Who Lives in Neighborhoods of Varying Poverty Levels by Race/Ethnicity (Affluent) (Very High Poverty) Source: American Community Survey, 2006-2010 and Census, 2010
Proportion Living in a High Poverty Neighborhood (where >20% of residents are poor) by Race/Ethnicity 1 in 15 White residents live in high-poverty neighborhoods, compared to: € € € € € € € € € € € € € € € 1 in 9 Asians € € € € € € € € € 1 in 4 Latinos € € € € 1 in 3 Blacks € € € Source: American Community Survey, 2006-2010 and Census, 2010
Proportion of Poor People Living in an Affluent Neighborhood (where <10% of residents are poor) by Race/Ethnicity 1 in 2 poor White residents live in affluent neighborhoods, compared to: € € 1 in 3 poor Asians € € € 1 in 6 poor Blacks € € € € € € 1 in 7 poor Latinos € € € € € € € Source: American Community Survey, 2006-2010 and Census, 2010
Racial Gaps in Health Life Expectancy at Birth by Race, 1960-2010 6.6 yrs 4.0 yrs Source: Alameda County Vital Statistics files, 1960-2010
Racism (Not Race) Harms Health Source: Alameda County Vital Statistics files, 2008-2010
Poor and Inequitable Health Outcomes in Low-Income Communities of Color Inequitable Economic Conditions • Employment • Job Wages • Household Income • Wealth
Access to Employment:Unemployment Rate by Neighborhood Poverty Level 2.1X Higher (Affluent) (Very High Poverty) Source: American Community Survey, 2007-2011
Access to Jobs that Pay Adequate Wages:Top 5 Occupations by Neighborhood Poverty Level Alameda County Self-Sufficiency Standard for 1 Adult in 2011 = $27,456 Source: American Community Survey, 2007-2011
Access to Income: Average Annual Household Income by Neighborhood Poverty Level 2.4 Fold Difference (Affluent) (Very High Poverty) Source: American Community Survey, 2007-2011
Access to Wealth: Rates of Foreclosure by Neighborhood Poverty Level 2.4X Higher (Affluent) (Very High Poverty) Source: CAPE, with data from HUD and from First American Title via Urban Strategies Council, 2006-2009
Poor and Inequitable Health Outcomes in Low-Income Communities of Color Inequitable Psycho-Social Conditions • Educational Attainment • School Quality • School Attendance • Crime and Violence • Criminal Justice • Stress and Mental Health
Access to Education and Quality Schools:Educational Attainment by Neighborhood Poverty Level 3.8X Higher (Affluent) (Very High Poverty) Source: American Community Survey, 2007-2011
Academic Performance by Neighborhood Poverty Level Oakland Public School Students 3rd Grade English-Language Arts 2.4-fold difference (Affluent) (Very High Poverty) Source: OUSD , 2011-12
Chronic Absenteeism Rate (% of Students Absent for 10%+ of Enrolled School Days) by Neighborhood Poverty Level Over 2X Higher (Affluent) (Very High Poverty) Source: OUSD, 2011-12
Crime and Violence:Homicide Death Rate by Neighborhood Poverty Level 7.9X Higher (Affluent) (Very High Poverty) Source: Alameda County Vital Statistics files, 2008-2010
Mass Incarceration: Youth Incarceration Rate by Neighborhood Poverty Level 1 out of 40 youthincarcerated 5.4X Higher 1 out of 200 youthincarcerated (Affluent) (Very High Poverty) Source: CAPE with data from Urban Strategies Council & the Alameda County Probation Department, 2010 (Aug) -2011 (June)
Hypertension:Hypertension Hospitalization Rates by Neighborhood Poverty Level* 1.7X Higher (Affluent) (High Poverty) *Includes hospitalizations with hypertension as a primary or top 4 associated diagnosisHospitalization rates and neighborhood poverty are at the zip code level Source: Alameda County OSHPD files, 2009-2011
Hypertension:Hypertension Hospitalization Rates by Race/Ethnicity Source: Alameda County OSHPD files, 2009-2011
Mental Health:Rate of Visits to the Emergency Department for Severe Mental Illness* 2.7X Higher (Affluent) (High Poverty) * Includes ED visits with severe mental disorders as primary or top 4 associated diagnosisED rates and neighborhood poverty are at the zip code level Source: Alameda County OSHPD files, 2009-2011 with input from Alameda County Behavioral Health Care Services
Poor and Inequitable Health Outcomes in Low-Income Communities of Color InequitableBuilt Environment Conditions • Housing Quality and Affordability • Transit Dependence • Street Safety • Supermarkets and Healthy Foods • Clean Air and Water
Access to Quality Housing:Age of Housing by Neighborhood Poverty Level Over 2X Higher (Affluent) (Very High Poverty) Source: American Community Survey, 2007-2011
Household Overcrowding by Neighborhood Poverty Level Over 4X Higher 14% 11% 7% 3% (Affluent) (Very High Poverty) Source: American Community Survey, 2007-2011
Access to Affordable Housing:Rental Housing Cost Burden by Neighborhood Poverty Level 1.5X Higher 1.9X Higher (Affluent) (Very High Poverty) Source: American Community Survey, 2007-2011
Access to Transportation:Zero Vehicle Households by Neighborhood Poverty Level About 7X Higher (Affluent) (Very High Poverty) Source: American Community Survey, 2007-2011
Access to Safe StreetsAdjusted Rate of Pedestrian Injuries & Deaths by Neighborhood Poverty Level 3.8X Higher (Affluent) (Very High Poverty) Source: CAPE with data from SWITRS, 2006-2010
Access to Supermarkets:Limited Supermarket Access (LSA) score by Neighborhood Poverty Level LimitedSupermarket Access More Limited Supermarket Access GreatestSupermarket Access (Affluent) (Very High Poverty) Source: CAPE with data from the Reinvestment Fund, 2011
Exposure to Liquor Stores:Off-Sale Liquor Outlet Densityby Neighborhood Poverty Level 1.7X Higher Source: CAPE with data from Department of Alcohol Beverage Control, 2013