Download
1 / 36
360 likes | 521 Vues
The CMQCC Maternal Data Center (CMDC): Resources for your Perinatal Quality Program. Anne Castles, MPH, MA Kathryn Melsop, MS CMDC Project Managers Elliott Main, MD CMQCC Medical Director. Presented at Washington State Hospital Association Safe Table 11/19/2013. CPQCC and CMQCC.

E N D
The CMQCC Maternal Data Center (CMDC): Resources for your Perinatal Quality Program Anne Castles, MPH, MA Kathryn Melsop, MSCMDC Project Managers Elliott Main, MD CMQCC Medical Director Presented at Washington State Hospital Association Safe Table 11/19/2013
CPQCC and CMQCC Mission: Improving care for moms and newborns California Perinatal Quality Care Collaborative (CPQCC) Expertise in data capture from hospitals Established Perinatal Data Center in 1996 Data use agreements in place with 130 hospitals with NICUs Model of working with state agencies to provide data of value California Maternal Quality Care Collaborative (CMQCC) Expertise in maternal data analysis Developer of QI toolkits Host of collaborative learning sessions Established Maternal Data Center in 2011 Presented at Washington State Hospital Association Safe Table 11/19/2013
What is the CMDC? (And how can data help my hospital??) A low-cost, low-burden, online tool providing hospitals with: • Overall hospital performance measures • Drill-down statistics and case review worksheets to identify quality improvement opportunities—for both clinical quality and data quality • Provider-level statistics—to assess variation within a hospital • Benchmarking statistics--to compare your hospital to regional, statewide, and like-hospital peers • Facilitating reporting to Leapfrog, Cal-HEN and PSF Presented at Washington State Hospital Association Safe Table 11/19/2013
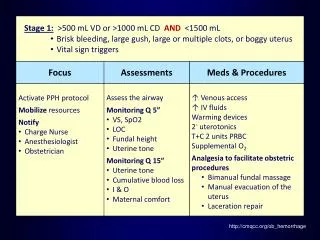
NEW! CMDC Drill-Down Tools for Primary Cesareans • Background • C-section rates continue to rise in CA and nationwide (2012 CA rate: 33.2%) • Tremendous variation in CS rates across hospitals (and across providers within hospitals) • The Nulliparous, Term, Singleton Vertex (NTSV) population has accounted for the largest portion of the 50% increase in the overall Cesarean birth rate in the last decade and accounts for > 90% of the variation seen among hospital primary cesarean birthrates. Presented at Washington State Hospital Association Safe Table 11/19/2013
Total CS Rate Among 251 California Hospitals 2011-2012(Source: CMQCC--California Maternal Data Center combining primary data from OSHPD and Vital Records) Range: 15.0—71.4% Median: 32.5% Mean: 32.8% 5 July 24, 2013 Presented at Washington State Hospital Association Safe Table 11/19/2013
Low-Risk First-Birth (Nuliparous Term Singleton Vertex) CS Rate (endorsed by NQF, TJC PC-02, CMS, HP2020) Among 249 California Hospitals: 2011-2012(Source: CMQCC--California Maternal Data Center combining primary data from OSHPD and Vital Records) Range: 10.0—75.8% Median: 27.0% Mean: 27.7% National Target =23.9% 36% of CA hospitals meet national target 6 July 24, 2013 Presented at Washington State Hospital Association Safe Table 11/19/2013
California Maternal Data Center WebEx Demonstration Presented at Washington State Hospital Association Safe Table 11/19/2013
8 Presented at Washington State Hospital Association Safe Table 11/19/2013
Presented at Washington State Hospital Association Safe Table 11/19/2013
Presented at Washington State Hospital Association Safe Table 11/19/2013
Presented at Washington State Hospital Association Safe Table 11/19/2013
Presented at Washington State Hospital Association Safe Table 11/19/2013
Presented at Washington State Hospital Association Safe Table 11/19/2013
Presented at Washington State Hospital Association Safe Table 11/19/2013
Presented at Washington State Hospital Association Safe Table 11/19/2013
Presented at Washington State Hospital Association Safe Table 11/19/2013
Presented at Washington State Hospital Association Safe Table 11/19/2013
Low-Burden Data Collection PDD--Discharge Diagnosis File (ICD9 codes) Birth File (Clinical Data) Hospital to CMQCC Hospital to CMQCC CMQCC Data Center • LIMITED CHART REVIEW • Roadmap Metrics • Optionally: • ED<39 Weeks • Antenatal Steroids • Bilirubin Screen • DVT Prophylaxis Calculates all the Measures REPORTSBenchmarks against other hospitals Sub-measure reports Presented at Washington State Hospital Association Safe Table 11/19/2013
California Maternal Data Center WebEx Demonstration Presented at Washington State Hospital Association Safe Table 11/19/2013
Active Track Steps Coordination • Complete a Participation Agreement • Identify IT staff to upload patient discharge and birth data to the CMDC on a monthly or quarterly basis: • Patient Discharge Data just like CHARS submission • Birth Data includes 5-10 key data elements (GA, Parity, Birthweight, Delivering Provider, Apgar Score, ICU admission) • Identify staff to complete medical chart review for the records that require additional information for select “Roadmap” measures and OPTIONALLY: • Antenatal Steroids • Bilirubin Screening • DVT Prophylaxis for CS cases Use Results for Clinical and Data QI • Participate in training and quality review session with. Presented at Washington State Hospital Association Safe Table 11/19/2013
CMDC Participation Current Participation: 45 California hospitals now actively submitting data; 30 more in the pipeline (as of October 2013) Our CMDC Users Say…. This is one of the easiest to use, comprehensive quality improvement tools I have ever seen. David Lagrew MD, Chief Integration and Accountability Officer, Memorial Care Health System I absolutely love the richness of this data that we can take to our medical staff and administrative teams to see how well we are doing and where we need to focus on our quality improvement. Kristi Gabel, Perinatal CNS, Sutter Roseville Medical Center CMDC has helped us improve our 39 week elective deliveries. We went from 22% to 5% by getting accurate data and this team helped us to keep focused. The CMDC team is excellent. They are quick to answer your questions is a way you can understand. They have a positive, knowledgeable and action oriented team. I am so happy to be part of this. Debbie Groth, Director, Maternal and Child Health, El Camino Hospital, Mountain View We are loving the CMDC! It has truly expanded our quality reporting and ongoing analysis. Cynthia Fahey, MSN, RN, Clinical Quality Coordinator, Community Memorial Hospital, Ventura Presented at Washington State Hospital Association Safe Table 11/19/2013
Value beyond Joint Commission Reporting • CMDC metrics represent entire population of deliveries • Likely to reduce “skew” due to sampling from quarter to quarter • Easy identification of facility-specific QI opportunities • Drill-down patient level information • Data quality reports to identify coding issues that impact performance • Case review worksheets • Metrics beyond Joint Commission Perinatal Care set • Statewide, regional and system-wide benchmarks Presented at Washington State Hospital Association Safe Table 11/19/2013
California Maternal Data Center Screen Shots Presented at Washington State Hospital Association Safe Table 11/19/2013
Uploading Data Files • Hospital uploads Discharge Data for one or more months • CMQCC receives Birth Data directly from Vital Records • After both files uploaded, linkage occurs instantaneously. • If additional matching or record review required, notation “Action Needed” appear Presented at Washington State Hospital Association Safe Table 11/19/2013
Data Entry for Chart Review •Once the data linkage is complete, the system performs the preliminary analysis for the measures that require chart review . •A worksheet can be printed to give to Medical Records and use for review •Data is entered by clicking into this interactive screen Each Data Field can be sorted Data Entry by clicking Presented at Washington State Hospital Association Safe Table 11/19/2013
CMDC Measures *Requires additional limited chart review Labor and Birth Measures • Elective Delivery <39 Weeks (PC-01)* • Episiotomy Rate • OB Trauma (3/4th Laceration)-Cesarean Delivery (AHRQ EXP-2) • OB Trauma (3/4th Laceration)-Vaginal Delivery w/ Instrument (AHRQ PSI 18) • OB Trauma (3/4th Laceration)-Vaginal Delivery w/o Instrument (AHRQ PSI 19) • Cesarean Section--Nulliparous, Term, Singleton, Vertex (PC-02) • Cesarean Section--Nulliparous, Term, Singleton, Vertex, Age Adjusted (PC-02) • Cesarean Section--Term, Singleton, Vertex (AHRQ IQI 21) • Cesarean Section—Primary (AHRQ IQI 33) • Total Cesarean Rate • Induction Rate • Failed Induction Rate • Appropriate DVT Prophylaxis in Women Undergoing C-Section (Leapfrog)* • Vaginal Birth After Cesarean (VBAC) Rate, All (AHRQ IQI 34) • Vaginal Birth After Cesarean (VBAC) Rate, Uncomplicated (AHRQ IQI 22) Newborn Measures • Newborn Bilirubin Screening Prior to Discharge (Leapfrog)* • 5 Minute APGAR <7 Among All Deliveries >39 weeks (HEN) • 5 Minute APGAR <7 in Early Term Newborns (HEN) Birth Trauma - Injury to Neonate (AHRQ PSI 17) • Unexpected Newborn Complications (NQF) Prematurity Measures • Antenatal Steroids (PC-03) • Antenatal Steroids-Leapfrog • VLBW (<1500g) NOT delivered at a Level III NICU Presented at Washington State Hospital Association Safe Table 11/19/2013
Reporting Center •Each measure is displayed graphically and as a data table •Each measure can be downloaded either as an image for use in presentations or as a data file to be used in reports Select quality measure to display Select comparison group(s) for your hospital Click on rate to “Drill Down” to see the numerator cases Download this measure (data file) (image) Presented at Washington State Hospital Association Safe Table 11/19/2013
Drill Down Information • Can drill down to see case-level information • Hover boxes show definitions for ICD-9 codes Presented at Washington State Hospital Association Safe Table 11/19/2013
Data Quality Reports • Identify discrepancies or missing data in Birth Certificate and Discharge data files • Use to target data performance/quality improvement Screen shot from the California Maternal Data Center
Presented at Washington State Hospital Association Safe Table 11/19/2013
Data Quality Reports • Identify discrepancies or missing data in Birth Certificate and Discharge data files • Use to target data quality improvement
Targeting QI Activities What is driving your Elective Delivery<39 Weeks Rate? Presented at Washington State Hospital Association Safe Table 11/19/2013
Comparative Statistics on: Demographic Indicators Maternal Conditions Delivery Methods Prematurity Rates Length of Stay Presented at Washington State Hospital Association Safe Table 11/19/2013
Presented at Washington State Hospital Association Safe Table 11/19/2013
Data Edit Tool: to allow fixing of data prior to submission Presented at Washington State Hospital Association Safe Table 11/19/2013
Two Security Gates Presented at Washington State Hospital Association Safe Table 11/19/2013