Download
1 / 16
160 likes | 268 Vues
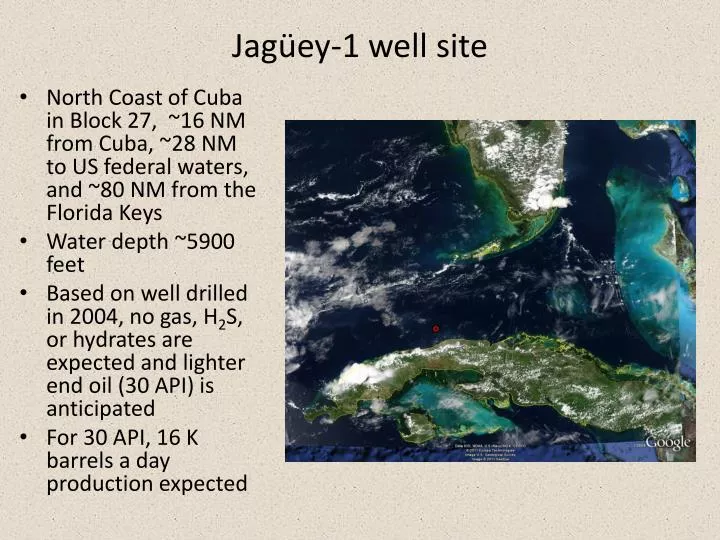
Jagüey -1 well site. North Coast of Cuba in Block 27, ~16 NM from Cuba, ~28 NM to US federal waters, and ~80 NM from the Florida Keys Water depth ~5900 feet Based on well drilled in 2004, no gas, H 2 S, or hydrates are expected and lighter end oil (30 API) is anticipated

E N D
Jagüey-1 well site • North Coast of Cuba in Block 27, ~16 NM from Cuba, ~28 NM to US federal waters, and ~80 NM from the Florida Keys • Water depth ~5900 feet • Based on well drilled in 2004, no gas, H2S, or hydrates are expected and lighter end oil (30 API) is anticipated • For 30 API, 16 K barrels a day production expected
Transport pathways in the Florida Straits • Within the Florida Straits a strong ocean current flows toward the east from the Gulf of Mexico • The Florida Current is the beginning of the Gulf Stream which flows north along the US East Coast • On the average, the inner edge of the Gulf Stream is within 10 miles of Miami and Ft. Lauderdale, FL, and at times there can be >3 knot flow within a few miles of the coast • Due to fast surface currents in the Florida Current/Gulf Stream, strong onshore winds would be required for shoreline impacts to Florida http://oceancurrents.rsmas.miami.edu/atlantic/florida.html
Statistical modeling – MMS (2002) • Trajectories from instantaneous releases from 3 locations along Cuba coast • Less than 0.5% probability of shoreline impacts along U.S. coast within 3 days; ~10-20% within 10 days • Segments 19-26 (top right panel) have 0.5-9% probability of impacts within 10 days
Statistical modeling – ASA (2010) • Scenarios: • Large/small diesel spills (873/349 tons) during Mar-Oct and Oct-Mar • Two hundred 14-day scenarios (from instantaneous releases) run using six years of modeled currents/winds • Calculate probabilities of oil on water surface, shoreline oiling, and minimum travel time • ~10-20% of trajectories impact Florida Worst case scenario defined as the scenario leading to the shortest time to shoreline impact • First impacts in Florida Keys in 6-9 days Oil trajectory Probability of shoreline oiling
In the event of an actual spill, NOAA OR&R would use real-time observations and models to forecast oil movement • Necessary components for oil trajectory forecasting • Surface oil observations, ocean current forecasts, wind forecasts • Method of determining uncertainty
Surface Oil Observations • Satellite detection of oil came of age during Deepwater Horizon spill • Detection algorithms applied across all available imagery • E.g. during DWH spill, some potential slicks were detected off Cuba • Analysis of currents suggested source in Yucatan Straits rather than DWH • Was not confirmed to be oil on subsequent overflights • overflights with trained observers still critical to providing accurate estimation of surface oil distribution
Ocean Current Forecasts • NOAA OR&R has access to output from multiple operational models (~10) that cover Florida Straits • NAVO/NRL (NCOM, NCOM-AMSEAS, HYCOM, HYCOM-GOM, IASNFS) • NOAA (NGOM, RTOFS) • Academic (SABGOM) • Models assimilate satellite observations improving accuracy of representing Loop Current, Florida Current, Gulf Stream • Numerous models allow an ensemble approach similar to that used during Deepwater Horizon http://www7320.nrlssc.navy.mil/IASNFS_WWW/
Wind forecasts • In addition to ocean currents, wind forecasts are critical to predicting movement of oil • Winds at well site are most frequently NE or NNE • Numerous met buoys provide real-time wind measurements • For forecasts we use NWS gridded forecasts and spot forecasts • NOAA Tropical Prediction Center covers Cuban waters
Additional Real-time observations • HF radar off SE Florida • Surface drifters • NAVO ocean features analysis for Gulf Stream position – gives distance of Florida Current from shoreline • NOAA/AOML Ocean current analysis • Satellite derived ocean currents • Satellite derived surface winds
Putting it all together in GNOME (General NOAA Operational Model Environment) • Surface oil observations are used to initialize oil spill trajectory model • Trajectories of oil movement are calculated using multiple sources of forecast currents/winds • Suite of model runs bounds uncertainty in prediction
Final forecast product • Similar to during DWH, NOAA OR&R would produce at least daily forecasts of surface oil • First DWH trajectory forecast produced 4/21/2010, ~11 AM CDT • Forecasts give predicted distribution of oil in 24/48/72 hours and include uncertainty on prediction
Trajectory forecasting for potential future spills • Forecasts of ocean currents and winds generally have decreasing skill beyond 3 days • Prediction of where oil might come ashore from future spills or far into the future relies on statistical approach • Early in DWH, OR&R produced statistical picture of potential impacts should the release continue 90 days into the future • Results are probabilities of impact and travel times
Parameters for the statistical simulation • 500 simulations – random start times in April or May, 1992-2007 • 90 day constant rate release • 10,000 particles • “Medium Crude” weathering • 20nm square receptor grid