Download
1 / 21
210 likes | 333 Vues
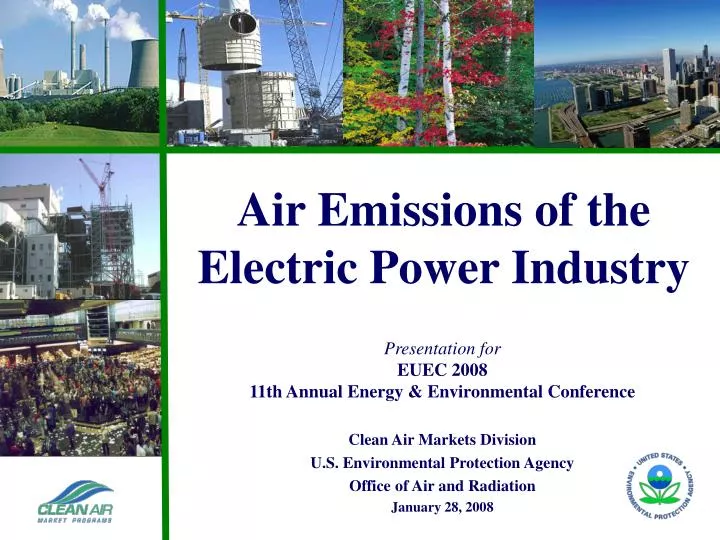
Air Emissions of the Electric Power Industry. Presentation for EUEC 2008 11th Annual Energy & Environmental Conference Clean Air Markets Division U.S. Environmental Protection Agency Office of Air and Radiation January 28, 2008. A lot of Pollution Reduction Has Occurred,

E N D
Air Emissions of the Electric Power Industry Presentation for EUEC 2008 11th Annual Energy & Environmental Conference Clean Air Markets Division U.S. Environmental Protection Agency Office of Air and Radiation January 28, 2008
A lot of Pollution Reduction Has Occurred, But Much More Work Remains Growth and Progress Reducing Air Emissions Continuing Work… Clean Air Act • Air Quality Improvement • NAAQS Review • State Implementation Plans (SIPs) • NSR/PSD • Air Toxics • MACT Reviews • Regional Haze • SIPs Greenhouse Gases • Federal voluntary programs to lower greenhouse gases and development of cleaner technology, while: • States start to address GHGs and • Congress considers legislation
Electric Power Industry Is Reducing Emissions through Energy Efficiency • Energy efficiency is a near-term, low-cost approach for reducing GHG emissions. • Growing investment in energy efficiency in coming years • US EPA and US DOE facilitate the National Action Plan for Energy Efficiency to remove barriers to cost-effective energy efficiency. • 60 member public-private Leadership Group developed 5 recommendations and commits to take action • Commitments to energy efficiency by 120 organizations • Resources available to help meet commitments, including how-to guides, resource database, and Vision for 2025 • For more information: www.epa.gov/eeactionplan Stacy Angel, angel.stacy@epa.gov, 202.343.9606 • Recommendations • Recognize energy efficiency as a high-priority energy resource. • Make a strong, long-term commitment to implement cost-effective energy efficiency as a resource. • Broadly communicate the benefits of and opportunities for energy efficiency. • Provide sufficient, timely and stable program funding to deliver energy efficiency where cost-effective. • Modify policies to align utility incentives with the delivery of cost-effective energy efficiency and modify ratemaking practices to promote energy efficiency investments.
Residential: Labeled Products 50+ products 2,000+ manufacturers Labeled New Homes ~20-30% more efficient Home Improvement beyond products ducts / home sealing whole home retrofits EPA Offers ENERGY STARas Platform to Leverage Comm & Ind : Corporate Energy Management • standardized measurement • establish goals, prioritize investment(management, systems vs. widgets) • whole building label for excellence • sector focuses • technical assistance Labeled Products • plug loads, not system components Small Business International partnerships – Canada, EU, Japan, etc
25 million vehicles worth of GHGs $14 billionsaved on energy bills 170 billion kWhenergy saved --about 5% of US electricity sales 70%+ public awareness 12,000 organizations engaged in manufacturing, delivery, and adoption 2.5 billion+ qualified products sold to date ~12%of new homes starts ENERGY STAR 2006 Accomplishments
Successful Emissions Trading Programs Emerge from the 1990s NOx Budget Trading Program (NBP) covers ozone season (summer) NOx emissions in selected eastern states for fossil-fuel generator units (and other large stationary sources). There is also partial coverage of MO, MI, and AL. Earlier northeastern program replaced beginning in 2004. Acid Rain Program (ARP) covers fossil generation annual SO2 emissions and NOx emissions of coal-fired generators > 25MWe in contiguous U.S. (shown in blue and red). Largest SO2 and NOx emitters faced control in 1995 and 1996, respectively; all others in program in 2000.
ARP Has Led to Large SO2 Reductions, Especially from States with Higher Emissions
Acid Rain Program Progress Annual Mean Wet Sulfate Deposition 2004-2006 1989-1991
Acid Rain SO2 Program Costs: Much Lower than Originally Predicted Billions 2006 $ 1990 1994 2004 Estimates of Full Program Costs in 2010 Source: EPA, 2006
NOX Budget Trading Program (NBP) NOx SIP Call Program Implementation Ozone Season NOx Emissions from All NBP Sources • The NBP is a market-based cap and trade program created to reduce NOx emissions from power plants and other large combustion sources in the eastern United States • The NBP affected 2,570 units in 2006
NOx Budget Trading Program Leads to Much Better Ozone Air Quality Results The NBP appears to be the most significant contributor to ozone improvements among several EPA programs Changes in 8-Hour Ozone Nonattainment Areas in the East 2001-2003 (Original Designations) Versus 2004-2006 • In 2004, the EPA officially designated 104 areas in the East as 8-hour ozone nonattainment areas • Data from 2004-2006 show ozone air quality improvements in all of these areas, bringing cleaner air to over 55 million people • In 2006, four out of five of the original nonattainment areas now meet the ozone standard Note: States participating in the NBP in 2006 are shown inside the black boundary line.
States controlled for fine particles (annual SO2 and NOx) States controlled for ozone (ozone season NOx) States controlled for both fine particles (annual SO2 and NOx) and ozone (ozone season NOx) CAIR Sets Stage for CAMR and CAVR CAIR Emission Caps* (million tons) 2009/20102015 Annual SO2 3.7 2.6 (2010) Annual NOx 1.5 1.3 (2009) Seasonal NOx 0.6 0.5 (2009) *For the affected region. CAMR Emissions Caps (tons) 20102018 Annual Mercury 38 15 CAVR Outside of CAIR Region – BART States not covered by CAIR, which are covered by CAVR Note: All States are covered by CAMR. For CAIR, there is a one time annual compliance supplement pool of NOx allowances of roughly 200,000 tons that are not reflected in the cap levels here.
National NOx and SO2 Power Plant Emissions:Historic and Projected with CAIR SO2 NOx Projected, w/ CAIR 2006 Source: EPA
SO2 Forecast with ARP and CAIR/CAMR/CAVR Annual SO2 Emission (1,000 t/yr)
NOx Forecast with ARP, NBP, and CAIR/CAMR/CAVR Annual NOX Emissions (1,000 t/yr)
Advanced Pollution Controls for SO2 and NOX that Are Installed, Committed to, and Projected for Coal-fired Generation Gigawatts Gigawatts Projected 2020 SCR & Scrubber Projected 2015 Projected 2020 SCR & Scrubber Projected 2020 Projected 2015 SCR & Scrubber Committed 2007-2010 Projected 2015 Projected 2010 Committed 2007-2010 SCR SCR SCR Committed 2007-2010 Installed by 2006 Scrubber Scrubber Scrubber Installed by 2006 Installed by 2006 The left bar graph provides the amount of coal-fired steam capacity that has either Scrubbers, SCRs, or both technologies in place by 2006 (from EPA’s NEEDs database 2007), committed to be operational from 2007-2010 (largely from 2007 survey results), and forecasted by EPA (using IPM) to be operating by the end of 2010, 2015, and 2020, respectively. In 2006, 2010, 2015, and 2020, the total coal-fired capacity is 318 GW, 320 GW, 335 GW and 373 GW, respectively. The right bar graph shows for 2010, 2015, and 2020 the amount of coal-fired steam capacity with Scrubbers, SCRs, or both controls. Both bar graphs included existing and new generation capacity. Virtually all coal-fired generation units have advanced particulate control systems. Some additional units will have SNCR controls and EPA expects virtually all of these units to have NOx combustion controls and the vast majority of the “nonscrubbed” units to use lower sulfur coals.
Projected Retrofits at Coal-Fired Units in 2020 after CAIR/CAMR/CAVR
CAIR, CAMR, and CAVR’s Addition to Existing Programs Should Lead to Much Cleaner Air Areas Currently Designated as Nonattainment for PM2.5 and/or 8-Hour Ozone (April, 2005) Areas Projected to Meet the PM2.5 and 8-Hour Ozone Standards in 2020 with CAIR/CAMR/CAVR and Some Current Rules, Absent Additional Local Controls ---------- Area Count Both PM and Ozone Nonattainment 3 PM Only Nonattainment 13 Ozone Only Nonattainment 7 Nonattainment areas projected to attain 106
Benefits of Acid Rain and CAIR/CAMR Programs • All benefits estimates, except 2020 Acid Rain based on detailed analyses. 2020 Acid Rain is a simple extrapolation from 2010 estimates done conservatively (likely to be low) after review of predicted emission reductions, population growth and other factors. • Benefits driven by: • Reduced premature deaths • Lowering aggravation and incidence of heart and lung ailments • There also some benefits estimated for increased worker productivity, reduced absences from school and work, and visibility improvement in some parks • Many benefits not included in estimates: • CAIR’s Canadian Health Benefits • Acid rain environmental benefits • Mercury benefits • Remaining visibility benefits from parks and urban areas • Others 2010 2020 Note: All estimates used a 3% discount rate. Use of 7% discount rate would lower estimates about 15 percent. CPI-U used to convert 1999$ and 2000$ to 2006$. Sources: Used Chestnut & Mills Analysis, "A fresh look at the benefits and costs of the US acid rain program" (Oct. 1, 2004) for 2010 Acid Rain Benefits and EPA's Multi-pollutant Regulatory Analysis: CAIR, CAVR, CAMR (Oct. 2005) for 2010 and 2020 estimates for these programs. Acid Rain 2020 benefits extrapolated from 2010 estimates.
Emerging Programs to Address GHGs Often Rely on the Cap and Trade Model • States Are Setting Up Regional Trading Programs • Regional Greenhouse Gas Initiative (Northeastern US) • California • Others… • Congress Is Considering GHG Controls • Set Up Mandatory Emissions Reporting • Senate and House Developing Comprehensive Legislation* * EPA’s analysis of S.280 (McCain-Lieberman) and S. 1766 (Bingaman-Specter) can be found at::http://www.epa.gov/climatechange/economics/economicanalyses.htm
To Learn More….. On Energy Star programs go to EPA’s Climate Protection Partnerships Division Website at: www.energystar.gov On emissions trading go to EPA’s Clean Air Markets Division Website at: http://www.epa.gov/airmarkets/mp