Download

1 / 48
480 likes | 621 Vues
Session S317114: What Else Can I Do with System and Session Performance Data. Thomas Kyte http://asktom.oracle.com/. Agenda. History Key Concepts AWR How it works What else you can do with it beyond the GUI ASH How it works What else you can do with it beyond the GUI

E N D
Session S317114: What Else Can I Do with System and Session Performance Data Thomas Kyte http://asktom.oracle.com/
Agenda • History • Key Concepts • AWR • How it works • What else you can do with it beyond the GUI • ASH • How it works • What else you can do with it beyond the GUI • Command Line Reporting
Oracle Tuning Methods • Prehistoric (v5) • Debug code • Dark Ages (v6) • Counters/Ratios • BSTAT/ESTAT • SQL*Trace • Renaissance (v7) • Introduction of Wait Event instrumentation • Move from counters to timers • STATSPACK • Modernity (v10) • DB Time Tuning – Comprehensive tuning using fundamental notion of time in database • Multiple scoping levels • Always on, non-intrusive • Built into infrastructure: instrumentation, ASH, AWR, ADDM, EM
Database Time (DB Time) • Total time in database calls by foreground sessions • Includes CPU time, IO time and non-idle wait time • DB Time <> response time • New metric for Oracle performance analysis Database time is total time spent by user processes either actively working or actively waiting in a database call.
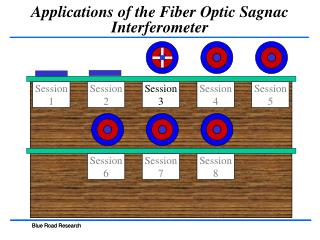
Fundamental Concepts Active Session = Session currently spending time in a database call Database Time (DB Time) =Total time session spent in all database calls Average Activity of the Session (% Activity) = The ratio of time active to total wall-clock time Browse Books Read Reviews For One Book Checkout Add to Cart = time spent in database TIME
Total Database Time Wall-Clock (Elapsed) Time At time t we have 2 active sessions t = time spent in database Multiple Sessions DB Time = Sum of DB Time Over All Sessions Avg. Active Sessions = Sum of Avg. Activity Over All Sessions = User 1 User 2 User 3 User n TIME
Automatic Workload Repository (AWR) • Built-in workload and performance statistics repository in the database • Automatically Captures Workload Data • Every 60 minutes, or manually, saves data for 8 days by default • Resides in SYSAUX tablespace • Space requirements automatically managed • Old data is automatically purged nightly based on retention interval • Stores different classes of data: • BASE STATISTICS e.g., physical reads • SQL STATISTICS e.g., disk reads (per sql stmt) • METRICS e.g., physical reads / sec • ACTIVE SESSION HISTORY (ASH)
T1 T2 T3 T4 Shutdown/startup You can report on: T3-T2 T4-T3 T4-T2 Automatic Workload Repository (AWR) • Every N-Units of time, data is flushed from memory to disk (a snapshot) • You can generate reports that cover any range of time (n-units of time at a time) • We simply “subtract” You can report on: T2-T1 T3-T2 T3-T1 T4-T3 T4-T2 T4-T1 select * from dba_hist_snapshot;
How much and how often… ops$tkyte%ORA11GR2> select snap_interval, retention from dba_hist_wr_control; SNAP_INTERVAL RETENTION ------------------- ------------------- +00000 01:00:00.0 +00008 00:00:00.0 ops$tkyte%ORA11GR2> begin 2 dbms_workload_repository.modify_snapshot_settings 3 ( interval => 20, retention => 14*24*60 ); 4 end; 5 / PL/SQL procedure successfully completed. ops$tkyte%ORA11GR2> select snap_interval, retention from dba_hist_wr_control; SNAP_INTERVAL RETENTION ------------------- ------------------- +00000 00:20:00.0 +00014 00:00:00.0 ops$tkyte%ORA11GR2> select snap_interval, retention from dba_hist_wr_control; SNAP_INTERVAL RETENTION ------------------- ------------------- +00000 01:00:00.0 +00008 00:00:00.0 ops$tkyte%ORA11GR2> begin 2 dbms_workload_repository.modify_snapshot_settings 3 ( interval => 20, retention => 14*24*60 ); 4 end; 5 / PL/SQL procedure successfully completed. ops$tkyte%ORA11GR2> select snap_interval, retention from dba_hist_wr_control; SNAP_INTERVAL RETENTION ------------------- ------------------- +00000 00:20:00.0 +00014 00:00:00.0
How do we access… • Underlying tables (WRH$ tables in the SYS schema) utilize partitioning (even if you don’t have it) when sensible • In support of the data purging • We use the DBA_HIST_* views • Documented in the Server Reference Guide ops$tkyte%ORA11GR2> select view_name from dba_views 2 where owner = 'SYS' and view_name like 'DBA\_HIST\_%' escape '\'; VIEW_NAME ------------------------------ DBA_HIST_ACTIVE_SESS_HISTORY … DBA_HIST_WR_CONTROL 108 rows selected.
T1 T2 T3 T4 SQL Enters Shared Pool SQL Leaves Shared Pool They are snapshots, not movies… • Remember – these are point in time snapshots • DBA_HIST_SQLTEXT will not be 100% complete for example • especially if you have a poorly written application
Metrics (rates of change) everywhere… • Many metrics are available • Joinable to DBA_HIST_SYSMETRIC_SUMMARY (long duration) • Or to DBA_HIST_SYSMETRIC_HISTORY (all recorded data, shorter term) ops$tkyte%ORA11GR2> select group_name, metric_name, metric_unit from dba_hist_metric_name 2 order by group_name, metric_name; GROUP_NAME METRIC_NAME METRIC_UNIT -------------------------------- --------------------------------------------- ------------------------ Event Class Metrics Average Users Waiting Counts Users Event Class Metrics Database Time Spent Waiting (%) % (TimeWaited / DBTime) Event Class Metrics Total Time Waited CentiSeconds Event Class Metrics Total Time Waited (Foreground) CentiSeconds … WLM PC Metrics User Calls Per Second User Calls Per Second 278 rows selected.
Metrics (rates of change) everywhere… • We’d like to see some metric • For some period of time • With the interval that metric is valid for • Numerically • “Graphically” BEGIN_TIME AVERAGE HG -------------------- ---------- -------------------------------- 14-sep-2010 01:00:27 5.66541413 ** 14-sep-2010 01:59:56 5.77505516 ** 14-sep-2010 02:59:27 5.52065565 ** 14-sep-2010 04:00:54 5.71057718 ** 14-sep-2010 05:00:19 5.5809264 ** 14-sep-2010 05:59:49 5.87360942 ** 14-sep-2010 06:59:06 5.1428971 * 14-sep-2010 07:58:38 4.97469016 * 14-sep-2010 09:00:00 45.8761183 ******************************* 14-sep-2010 10:00:55 7.83963704 *** 14-sep-2010 10:59:46 5.43147809 * 14-sep-2010 12:00:52 5.29527252 * 14-sep-2010 12:29:24 5.86617054 ** 14-sep-2010 15:00:34 4.04194349 * 14-sep-2010 15:59:15 5.12650636 * 14-sep-2010 17:00:21 5.61648183 ** 14-sep-2010 17:59:53 5.39218885 * 14-sep-2010 19:01:09 4.96873127 * 14-sep-2010 20:00:43 5.38695014 * 14-sep-2010 20:59:58 4.93064773 * 14-sep-2010 21:59:07 5.85997655 ** 14-sep-2010 22:58:44 4.61709545 * 22 rows selected.
ASCII Art – who needs a GUI… ops$tkyte%ORA11GR2> select begin_time, average, 2 rpad( '*', 1+(average-min_avg)/spread, '*' ) hg 3 from ( 4 select begin_time, average, min(average) over () min_avg, 5 (max(average) over () - min(average) over ())/30 spread 6 from dba_hist_sysmetric_summary 7 where begin_time >= to_date( '14-sep-2010', 'dd-mon-yyyy' ) 8 and begin_time < to_date( '14-sep-2010', 'dd-mon-yyyy' )+1 9 and metric_name = 'User Commits Per Sec' 10 ) 11 order by begin_time 12 / ops$tkyte%ORA11GR2> select begin_time, average, 2 rpad( '*', 1+(average-min_avg)/spread, '*' ) hg 3 from ( 4 select begin_time, average, min(average) over () min_avg, 5 (max(average) over () - min(average) over ())/30 spread 6 from dba_hist_sysmetric_summary 7 where begin_time >= to_date( '14-sep-2010', 'dd-mon-yyyy' ) 8 and begin_time < to_date( '14-sep-2010', 'dd-mon-yyyy' )+1 9 and metric_name = 'User Commits Per Sec' 10 ) 11 order by begin_time 12 / ops$tkyte%ORA11GR2> select begin_time, average, 2 rpad( '*', 1+(average-min_avg)/spread, '*' ) hg 3 from ( 4 select begin_time, average, min(average) over () min_avg, 5 (max(average) over () - min(average) over ())/30 spread 6 from dba_hist_sysmetric_summary 7 where begin_time >= to_date( '14-sep-2010', 'dd-mon-yyyy' ) 8 and begin_time < to_date( '14-sep-2010', 'dd-mon-yyyy' )+1 9 and metric_name = 'User Commits Per Sec' 10 ) 11 order by begin_time 12 / ops$tkyte%ORA11GR2> select begin_time, average, 2 rpad( '*', 1+(average-min_avg)/spread, '*' ) hg 3 from ( 4 select begin_time, average, min(average) over () min_avg, 5 (max(average) over () - min(average) over ())/30 spread 6 from dba_hist_sysmetric_summary 7 where begin_time >= to_date( '14-sep-2010', 'dd-mon-yyyy' ) 8 and begin_time < to_date( '14-sep-2010', 'dd-mon-yyyy' )+1 9 and metric_name = 'User Commits Per Sec' 10 ) 11 order by begin_time 12 / ops$tkyte%ORA11GR2> select begin_time, average, 2 rpad( '*', 1+(average-min_avg)/spread, '*' ) hg 3 from ( 4 select begin_time, average, min(average) over () min_avg, 5 (max(average) over () - min(average) over ())/30 spread 6 from dba_hist_sysmetric_summary 7 where begin_time >= to_date( '14-sep-2010', 'dd-mon-yyyy' ) 8 and begin_time < to_date( '14-sep-2010', 'dd-mon-yyyy' )+1 9 and metric_name = 'User Commits Per Sec' 10 ) 11 order by begin_time 12 / BEGIN_TIME AVERAGE HG -------------------- ---------- -------------------------------- 14-sep-2010 01:00:27 5.66541413 ** 14-sep-2010 01:59:56 5.77505516 ** 14-sep-2010 02:59:27 5.52065565 ** 14-sep-2010 04:00:54 5.71057718 ** 14-sep-2010 05:00:19 5.5809264 ** 14-sep-2010 05:59:49 5.87360942 ** 14-sep-2010 06:59:06 5.1428971 * 14-sep-2010 07:58:38 4.97469016 * 14-sep-2010 09:00:00 45.8761183 ******************************* 14-sep-2010 10:00:55 7.83963704 *** 14-sep-2010 10:59:46 5.43147809 * 14-sep-2010 12:00:52 5.29527252 * 14-sep-2010 12:29:24 5.86617054 ** 14-sep-2010 15:00:34 4.04194349 * 14-sep-2010 15:59:15 5.12650636 * 14-sep-2010 17:00:21 5.61648183 ** 14-sep-2010 17:59:53 5.39218885 * 14-sep-2010 19:01:09 4.96873127 * 14-sep-2010 20:00:43 5.38695014 * 14-sep-2010 20:59:58 4.93064773 * 14-sep-2010 21:59:07 5.85997655 ** 14-sep-2010 22:58:44 4.61709545 * 22 rows selected.
System Statistics (cumulative counters) abound… • DBA_HIST_SYS_TIME_MODEL • The current statistic value from V$SYS_TIME_MODEL over time • V$SYS_TIME_MODEL = point in time • DBA_HIST_SYS_TIME_MODEL = over time ops$tkyte%ORA11GR2> select stat_name, round(value/1000000,2) seconds 2 from v$sys_time_model 3 order by stat_name 4 / STAT_NAME SECONDS ---------------------------------------------------------------- ---------- DB CPU 39.8 DB time 126.37 PL/SQL execution elapsed time 11.13 … 19 rows selected.
System Statistics abound… • We’d like to see some reported statistic (say parse time) • Over some period of time • In an associated interval BEGIN_INTERVAL_TIME LAST_TIME DIFF_SECS ------------------------- ------------------------- ---------- 14-SEP-10 01.01.01.986 AM 14-SEP-10 12.01.11.096 AM 2.57 14-SEP-10 02.00.47.933 AM 14-SEP-10 01.01.01.986 AM 2.86 14-SEP-10 03.00.19.167 AM 14-SEP-10 02.00.47.933 AM 2 … 14-SEP-10 08.01.21.975 PM 14-SEP-10 07.01.32.238 PM 3.28 14-SEP-10 09.00.47.946 PM 14-SEP-10 08.01.21.975 PM 63.1 14-SEP-10 10.00.45.535 PM 14-SEP-10 09.00.47.946 PM 49.35 14-SEP-10 11.00.43.823 PM 14-SEP-10 10.00.45.535 PM 4.08 23 rows selected.
System Statistics abound… • DBA_HIST_SYS_TIME_MODEL • We’ll need LAG() over () to make sense of it BEGIN_INTERVAL_TIME LAST_TIME DIFF_SECS ------------------------- ------------------------- ---------- 14-SEP-10 01.01.01.986 AM 14-SEP-10 12.01.11.096 AM 2.57 14-SEP-10 02.00.47.933 AM 14-SEP-10 01.01.01.986 AM 2.86 14-SEP-10 03.00.19.167 AM 14-SEP-10 02.00.47.933 AM 2 … 14-SEP-10 08.01.21.975 PM 14-SEP-10 07.01.32.238 PM 3.28 14-SEP-10 09.00.47.946 PM 14-SEP-10 08.01.21.975 PM 63.1 14-SEP-10 10.00.45.535 PM 14-SEP-10 09.00.47.946 PM 49.35 14-SEP-10 11.00.43.823 PM 14-SEP-10 10.00.45.535 PM 4.08 23 rows selected. ops$tkyte%ORA11GR2> select s.begin_interval_time, 2 lag(s.begin_interval_time) over(order by s.begin_interval_time) last_time, 3 round( (value-lag(m.value) over (order by s.begin_interval_time))/1000000, 2) diff_secs 4 from dba_hist_sys_time_model m , dba_hist_snapshot s 5 where m.stat_name = 'parse time elapsed' 6 and m.snap_id = s.snap_id 7 and s.begin_interval_time between trunc(sysdate)-2 and trunc(sysdate)-1 8 order by s.begin_interval_time 9 / ops$tkyte%ORA11GR2> select s.begin_interval_time, 2 lag(s.begin_interval_time) over(order by s.begin_interval_time) last_time, 3 round( (value-lag(m.value) over (order by s.begin_interval_time))/1000000, 2) diff_secs 4 from dba_hist_sys_time_model m , dba_hist_snapshot s 5 where m.stat_name = 'parse time elapsed' 6 and m.snap_id = s.snap_id 7 and s.begin_interval_time between trunc(sysdate)-2 and trunc(sysdate)-1 8 order by s.begin_interval_time 9 / ops$tkyte%ORA11GR2> select s.begin_interval_time, 2 lag(s.begin_interval_time) over(order by s.begin_interval_time) last_time, 3 round( (value-lag(m.value) over (order by s.begin_interval_time))/1000000, 2) diff_secs 4 from dba_hist_sys_time_model m , dba_hist_snapshot s 5 where m.stat_name = 'parse time elapsed' 6 and m.snap_id = s.snap_id 7 and s.begin_interval_time between trunc(sysdate)-2 and trunc(sysdate)-1 8 order by s.begin_interval_time 9 / ops$tkyte%ORA11GR2> select s.begin_interval_time, 2 lag(s.begin_interval_time) over(order by s.begin_interval_time) last_time, 3 round( (value-lag(m.value) over (order by s.begin_interval_time))/1000000, 2) diff_secs 4 from dba_hist_sys_time_model m , dba_hist_snapshot s 5 where m.stat_name = 'parse time elapsed' 6 and m.snap_id = s.snap_id 7 and s.begin_interval_time between trunc(sysdate)-2 and trunc(sysdate)-1 8 order by s.begin_interval_time 9 / ops$tkyte%ORA11GR2> select s.begin_interval_time, 2 lag(s.begin_interval_time) over(order by s.begin_interval_time) last_time, 3 round( (value-lag(m.value) over (order by s.begin_interval_time))/1000000, 2) diff_secs 4 from dba_hist_sys_time_model m , dba_hist_snapshot s 5 where m.stat_name = 'parse time elapsed' 6 and m.snap_id = s.snap_id 7 and s.begin_interval_time between trunc(sysdate)-2 and trunc(sysdate)-1 8 order by s.begin_interval_time 9 /
And of course, ASCII Art still rocks… • DBA_HIST_SYS_TIME_MODEL ops$tkyte%ORA11GR2> select begin_interval_time, diff_secs, 2 rpad( '*', 1+(diff_secs-min_diff_secs)/spread, '*' ) hg 3 from ( 4 select begin_interval_time, 5 diff_secs, 6 min(diff_secs) over () min_diff_secs, 7 (max(diff_secs) over ()-min(diff_secs) over ())/30 spread 8 from ( 9 select s.begin_interval_time, 10 lag(s.begin_interval_time) over(order by s.begin_interval_time) last_time, 11 round( (value-lag(m.value) over (order by s.begin_interval_time))/1000000, 2) diff_secs 12 from dba_hist_sys_time_model m , dba_hist_snapshot s 13 where m.stat_name = 'parse time elapsed' 14 and m.snap_id = s.snap_id 15 and s.begin_interval_time between trunc(sysdate)-2 and trunc(sysdate)-1 16 ) 17 where diff_secs is not null 18 ) 19 order by begin_interval_time 20 / ops$tkyte%ORA11GR2> select begin_interval_time, diff_secs, 2 rpad( '*', 1+(diff_secs-min_diff_secs)/spread, '*' ) hg 3 from ( 4 select begin_interval_time, 5 diff_secs, 6 min(diff_secs) over () min_diff_secs, 7 (max(diff_secs) over ()-min(diff_secs) over ())/30 spread 8 from ( 9 select s.begin_interval_time, 10 lag(s.begin_interval_time) over(order by s.begin_interval_time) last_time, 11 round( (value-lag(m.value) over (order by s.begin_interval_time))/1000000, 2) diff_secs 12 from dba_hist_sys_time_model m , dba_hist_snapshot s 13 where m.stat_name = 'parse time elapsed' 14 and m.snap_id = s.snap_id 15 and s.begin_interval_time between trunc(sysdate)-2 and trunc(sysdate)-1 16 ) 17 where diff_secs is not null 18 ) 19 order by begin_interval_time 20 / ops$tkyte%ORA11GR2> select begin_interval_time, diff_secs, 2 rpad( '*', 1+(diff_secs-min_diff_secs)/spread, '*' ) hg 3 from ( 4 select begin_interval_time, 5 diff_secs, 6 min(diff_secs) over () min_diff_secs, 7 (max(diff_secs) over ()-min(diff_secs) over ())/30 spread 8 from ( 9 select s.begin_interval_time, 10 lag(s.begin_interval_time) over(order by s.begin_interval_time) last_time, 11 round( (value-lag(m.value) over (order by s.begin_interval_time))/1000000, 2) diff_secs 12 from dba_hist_sys_time_model m , dba_hist_snapshot s 13 where m.stat_name = 'parse time elapsed' 14 and m.snap_id = s.snap_id 15 and s.begin_interval_time between trunc(sysdate)-2 and trunc(sysdate)-1 16 ) 17 where diff_secs is not null 18 ) 19 order by begin_interval_time 20 / ops$tkyte%ORA11GR2> select begin_interval_time, diff_secs, 2 rpad( '*', 1+(diff_secs-min_diff_secs)/spread, '*' ) hg 3 from ( 4 select begin_interval_time, 5 diff_secs, 6 min(diff_secs) over () min_diff_secs, 7 (max(diff_secs) over ()-min(diff_secs) over ())/30 spread 8 from ( 9 select s.begin_interval_time, 10 lag(s.begin_interval_time) over(order by s.begin_interval_time) last_time, 11 round( (value-lag(m.value) over (order by s.begin_interval_time))/1000000, 2) diff_secs 12 from dba_hist_sys_time_model m , dba_hist_snapshot s 13 where m.stat_name = 'parse time elapsed' 14 and m.snap_id = s.snap_id 15 and s.begin_interval_time between trunc(sysdate)-2 and trunc(sysdate)-1 16 ) 17 where diff_secs is not null 18 ) 19 order by begin_interval_time 20 / BEGIN_INTERVAL_TIME DIFF_SECS HG ------------------------- ---------- -------------------------------- … 14-SEP-10 05.01.27.818 AM 3.73 ** 14-SEP-10 06.01.02.893 AM 2.69 * 14-SEP-10 07.00.37.968 AM 3.62 ** 14-SEP-10 08.00.39.143 AM 1.55 * 14-SEP-10 09.00.20.581 AM 33.32 **************** 14-SEP-10 10.01.14.907 AM 11.55 ***** 14-SEP-10 11.00.14.259 AM 1.8 * 14-SEP-10 12.01.31.688 PM 2.48 * 14-SEP-10 02.19.26.383 PM 6.08 *** 14-SEP-10 03.01.24.127 PM 13.92 ******* 14-SEP-10 04.00.24.823 PM 1.94 * 14-SEP-10 05.01.48.046 PM 2.24 * 14-SEP-10 06.01.53.858 PM 2.05 * 14-SEP-10 07.01.32.238 PM 2.71 * 14-SEP-10 08.01.21.975 PM 3.28 * 14-SEP-10 09.00.47.946 PM 63.1 ****************************** 14-SEP-10 10.00.45.535 PM 49.35 ************************ 14-SEP-10 11.00.43.823 PM 4.08 ** 22 rows selected.
Goal: application level trace • AWR – instance level • Aggregated at too high a level of detail • Captured over too long a period of time • Although, it can be captured automatically without knowing there will be a problem ahead of time • SQL_TRACE • 100% of the details • That is the good news • That is also the bad news • Must be enabled manually • You have to replicate the problem in order to diagnose the problem
Active Session History (ASH) • Samples active sessions every one second into memory (v$active_session_history) – always there • Direct access to kernel structures • One of ten samples flushed to AWR at every snapshot (but which one…) • Data captured includes: • SID • SQL ID • Program, Module, Action • Wait event# • Object, File, Block • actual wait time (if captured while waiting) Enables targeted performance analysis of transient problems
Active Session History (ASH) Query for Khalid Husaini Novels Checkout using ‘one-click’ Browse and Read Reviews Add item to cart DB Time Time SID Module SQL ID State Event Book by author 7:38:26 213 qa324jffritcf WAITING db file sequential read 7:42:35 213 Get review id aferv5desfzs5 CPU 7:50:59 213 Add to cart hk32pekfcbdfr WAITING buffer busy wait 7:52:33 213 One click abngldf95f4de WAITING log file sync
Similar to SQL_TRACE • But remember – this is sampled data • Sql_trace is 100% complete – everything is there • Hence the somewhat onerous overhead • In most cases ASH is better than good enough to identify problems • And it is always on • No need to try to replicate a problem, we’ve already recorded it. • Attempts to keep approximately 1 hour of activity in memory – ready to go.
Gets fuzzier over time • V$ACTIVE_SESSION_HISTORY – about every second of activity • DBA_HIST_ACTIVE_SESS_HISTORY – every 10 seconds of activity • On demand flush • When ever in memory buffer (V$) is 2/3rds full • Retained using AWR retention policies Short term memory: V$ACTIVE_SESSION_HISTORY Long term memory: DBA_HIST_ACTIVE_SESS_HISTORY Point in time: V$SESSION V$SESSION_WAIT SGA Circular Buffer – sized By CPU_COUNT Every hour or 2/3rds full in SGA
What can you see with ASH on the command line • Let’s look at sessions in the hour • or minute or whatever • That were waiting for user initiated IO to complete • or whatever wait is interesting • And report the SQL they were executing at that time • If still available • If unambiguous • And show the SQL in order from the most IO waits to the least • or by wait time or whatever
-- Top *anything* SQL really – replace User I/O with any wait class select ash.sql_id, (select distinct decode( count(distinct sql_text) over (), 1, substr(sql_text,1,80)||'...', 'more than one sql matched' ) from v$sql where sql_id = ash.sql_id) sql, count(*) from v$active_session_history ash, v$event_name evt where ash.sample_time > sysdate - 1/24 and ash.session_state = 'WAITING' and ash.event_id = evt.event_id and evt.wait_class = 'User I/O' group by sql_id order by count(*) desc; -- Top *anything* SQL really – replace User I/O with any wait class select ash.sql_id, (select distinct decode( count(distinct sql_text) over (), 1, substr(sql_text,1,80)||'...', 'more than one sql matched' ) from v$sql where sql_id = ash.sql_id) sql, count(*) from v$active_session_history ash, v$event_name evt where ash.sample_time > sysdate - 1/24 and ash.session_state = 'WAITING' and ash.event_id = evt.event_id and evt.wait_class = 'User I/O' group by sql_id order by count(*) desc; -- Top *anything* SQL really – replace User I/O with any wait class select ash.sql_id, (select distinct decode( count(distinct sql_text) over (), 1, substr(sql_text,1,80)||'...', 'more than one sql matched' ) from v$sql where sql_id = ash.sql_id) sql, count(*) from v$active_session_history ash, v$event_name evt where ash.sample_time > sysdate - 1/24 and ash.session_state = 'WAITING' and ash.event_id = evt.event_id and evt.wait_class = 'User I/O' group by sql_id order by count(*) desc; -- Top *anything* SQL really – replace User I/O with any wait class select ash.sql_id, (select distinct decode( count(distinct sql_text) over (), 1, substr(sql_text,1,80)||'...', 'more than one sql matched' ) from v$sql where sql_id = ash.sql_id) sql, count(*) from v$active_session_history ash, v$event_name evt where ash.sample_time > sysdate - 1/24 and ash.session_state = 'WAITING' and ash.event_id = evt.event_id and evt.wait_class = 'User I/O' group by sql_id order by count(*) desc; -- Top *anything* SQL really – replace User I/O with any wait class select ash.sql_id, (select distinct decode( count(distinct sql_text) over (), 1, substr(sql_text,1,80)||'...', 'more than one sql matched' ) from v$sql where sql_id = ash.sql_id) sql, count(*) from v$active_session_history ash, v$event_name evt where ash.sample_time > sysdate - 1/24 and ash.session_state = 'WAITING' and ash.event_id = evt.event_id and evt.wait_class = 'User I/O' group by sql_id order by count(*) desc; -- Top *anything* SQL really – replace User I/O with any wait class select ash.sql_id, (select distinct decode( count(distinct sql_text) over (), 1, substr(sql_text,1,80)||'...', 'more than one sql matched' ) from v$sql where sql_id = ash.sql_id) sql, count(*) from v$active_session_history ash, v$event_name evt where ash.sample_time > sysdate - 1/24 and ash.session_state = 'WAITING' and ash.event_id = evt.event_id and evt.wait_class = 'User I/O' group by sql_id order by count(*) desc;
What can you see with ASH on the command line • Let’s look at all available observations (no time frame limit) • By SQL_ID • Summing up time on the CPU • And time spent waiting for IO • And time spent waiting for things other than IO • And report the SQL text in descending order by “almost” db-time • We’ll report cpu+wait, but we don’t have the “wait on the cpu” in this case
-- SQL by total CPU plus wait time, broken down by CPU, IO wait and non-IO wait select sql_id, (select distinct decode( count(distinct sql_text) over (), 1, substr(sql_text,1,80)||'...', 'more than one sql matched' ) from v$sql where sql_id = ash.sql_id) sql, cpu, non_io_wait, io_wait from ( select ash.sql_id, sum(case when ash.session_state = 'ON CPU' then 1 else 0 end ) cpu, sum(case when ash.session_state='WAITING' and ash.event#<>ev.user_io then 1 else 0 end) non_io_wait, sum(case when ash.session_state = 'WAITING' and ash.event# = ev.user_io then 1 else 0 end ) io_wait from v$active_session_history ash, (select event# user_io from v$event_name where wait_class = 'User I/O') ev group by ash.sql_id ) ash order by cpu+non_io_wait+io_wait desc; -- SQL by total CPU plus wait time, broken down by CPU, IO wait and non-IO wait select sql_id, (select distinct decode( count(distinct sql_text) over (), 1, substr(sql_text,1,80)||'...', 'more than one sql matched' ) from v$sql where sql_id = ash.sql_id) sql, cpu, non_io_wait, io_wait from ( select ash.sql_id, sum(case when ash.session_state = 'ON CPU' then 1 else 0 end ) cpu, sum(case when ash.session_state='WAITING' and ash.event#<>ev.user_io then 1 else 0 end) non_io_wait, sum(case when ash.session_state = 'WAITING' and ash.event# = ev.user_io then 1 else 0 end ) io_wait from v$active_session_history ash, (select event# user_io from v$event_name where wait_class = 'User I/O') ev group by ash.sql_id ) ash order by cpu+non_io_wait+io_wait desc; -- SQL by total CPU plus wait time, broken down by CPU, IO wait and non-IO wait select sql_id, (select distinct decode( count(distinct sql_text) over (), 1, substr(sql_text,1,80)||'...', 'more than one sql matched' ) from v$sql where sql_id = ash.sql_id) sql, cpu, non_io_wait, io_wait from ( select ash.sql_id, sum(case when ash.session_state = 'ON CPU' then 1 else 0 end ) cpu, sum(case when ash.session_state='WAITING' and ash.event#<>ev.user_io then 1 else 0 end) non_io_wait, sum(case when ash.session_state = 'WAITING' and ash.event# = ev.user_io then 1 else 0 end ) io_wait from v$active_session_history ash, (select event# user_io from v$event_name where wait_class = 'User I/O') ev group by ash.sql_id ) ash order by cpu+non_io_wait+io_wait desc; -- SQL by total CPU plus wait time, broken down by CPU, IO wait and non-IO wait select sql_id, (select distinct decode( count(distinct sql_text) over (), 1, substr(sql_text,1,80)||'...', 'more than one sql matched' ) from v$sql where sql_id = ash.sql_id) sql, cpu, non_io_wait, io_wait from ( select ash.sql_id, sum(case when ash.session_state = 'ON CPU' then 1 else 0 end ) cpu, sum(case when ash.session_state='WAITING' and ash.event#<>ev.user_io then 1 else 0 end) non_io_wait, sum(case when ash.session_state = 'WAITING' and ash.event# = ev.user_io then 1 else 0 end ) io_wait from v$active_session_history ash, (select event# user_io from v$event_name where wait_class = 'User I/O') ev group by ash.sql_id ) ash order by cpu+non_io_wait+io_wait desc; -- SQL by total CPU plus wait time, broken down by CPU, IO wait and non-IO wait select sql_id, (select distinct decode( count(distinct sql_text) over (), 1, substr(sql_text,1,80)||'...', 'more than one sql matched' ) from v$sql where sql_id = ash.sql_id) sql, cpu, non_io_wait, io_wait from ( select ash.sql_id, sum(case when ash.session_state = 'ON CPU' then 1 else 0 end ) cpu, sum(case when ash.session_state='WAITING' and ash.event#<>ev.user_io then 1 else 0 end) non_io_wait, sum(case when ash.session_state = 'WAITING' and ash.event# = ev.user_io then 1 else 0 end ) io_wait from v$active_session_history ash, (select event# user_io from v$event_name where wait_class = 'User I/O') ev group by ash.sql_id ) ash order by cpu+non_io_wait+io_wait desc; -- SQL by total CPU plus wait time, broken down by CPU, IO wait and non-IO wait select sql_id, (select distinct decode( count(distinct sql_text) over (), 1, substr(sql_text,1,80)||'...', 'more than one sql matched' ) from v$sql where sql_id = ash.sql_id) sql, cpu, non_io_wait, io_wait from ( select ash.sql_id, sum(case when ash.session_state = 'ON CPU' then 1 else 0 end ) cpu, sum(case when ash.session_state='WAITING' and ash.event#<>ev.user_io then 1 else 0 end) non_io_wait, sum(case when ash.session_state = 'WAITING' and ash.event# = ev.user_io then 1 else 0 end ) io_wait from v$active_session_history ash, (select event# user_io from v$event_name where wait_class = 'User I/O') ev group by ash.sql_id ) ash order by cpu+non_io_wait+io_wait desc;
What can you see with ASH on the command line • Let’s look at the last hour • And for each event • Find the min/max sample times – the period of times we observed this event • Add up the wait time for that event • And report the largest waited for things first
select ash.event, min(sample_time) start_time, max(sample_time)-min(sample_time) duration, round(sum(ash.wait_time+ash.time_waited)/1000000,2) wait_secs from v$active_session_history ash where ash.sample_time between systimestamp-numtodsinterval(1,'hour') and systimestamp group by ash.event order by wait_secs desc select ash.event, min(sample_time) start_time, max(sample_time)-min(sample_time) duration, round(sum(ash.wait_time+ash.time_waited)/1000000,2) wait_secs from v$active_session_history ash where ash.sample_time between systimestamp-numtodsinterval(1,'hour') and systimestamp group by ash.event order by wait_secs desc select ash.event, min(sample_time) start_time, max(sample_time)-min(sample_time) duration, round(sum(ash.wait_time+ash.time_waited)/1000000,2) wait_secs from v$active_session_history ash where ash.sample_time between systimestamp-numtodsinterval(1,'hour') and systimestamp group by ash.event order by wait_secs desc select ash.event, min(sample_time) start_time, max(sample_time)-min(sample_time) duration, round(sum(ash.wait_time+ash.time_waited)/1000000,2) wait_secs from v$active_session_history ash where ash.sample_time between systimestamp-numtodsinterval(1,'hour') and systimestamp group by ash.event order by wait_secs desc select ash.event, min(sample_time) start_time, max(sample_time)-min(sample_time) duration, round(sum(ash.wait_time+ash.time_waited)/1000000,2) wait_secs from v$active_session_history ash where ash.sample_time between systimestamp-numtodsinterval(1,'hour') and systimestamp group by ash.event order by wait_secs desc
What can you see with ASH on the command line • Let’s look at the last hour • And for each event • Find the min/max sample times – the period of times we observed this event • Add up the wait time for that event • And report the largest waited for things first • By session
select ash.session_id, au.username, round(sum(ash.wait_time+ash.time_waited)/1000000,2) wait_secs from v$active_session_history ash, all_users au where ash.sample_time >= systimestamp-numtodsinterval(1,'hour') and ash.user_id = au.user_id group by ash.session_id, au.username order by wait_secs DESC select ash.session_id, au.username, round(sum(ash.wait_time+ash.time_waited)/1000000,2) wait_secs from v$active_session_history ash, all_users au where ash.sample_time >= systimestamp-numtodsinterval(1,'hour') and ash.user_id = au.user_id group by ash.session_id, au.username order by wait_secs DESC select ash.session_id, au.username, round(sum(ash.wait_time+ash.time_waited)/1000000,2) wait_secs from v$active_session_history ash, all_users au where ash.sample_time >= systimestamp-numtodsinterval(1,'hour') and ash.user_id = au.user_id group by ash.session_id, au.username order by wait_secs DESC
What can you see with ASH on the command line • Let’s look at the last hour • And for each event • Find the min/max sample times – the period of times we observed this event • Add up the wait time for that event • And report the largest waited for things first • For a given session, by sql statement used in that session
select (select distinct decode( count(distinct sql_text) over (), 1, substr(sql_text,1,80)||'...', 'more than one sql matched' ) from v$sql where sql_id = ash.sql_id) sql, round(sum(ash.wait_time+ash.time_waited)/1000000,2) wait_secs from v$active_session_history ash where ash.session_id = 1065 group by ash.sql_id order by wait_secs DESC select (select distinct decode( count(distinct sql_text) over (), 1, substr(sql_text,1,80)||'...', 'more than one sql matched' ) from v$sql where sql_id = ash.sql_id) sql, round(sum(ash.wait_time+ash.time_waited)/1000000,2) wait_secs from v$active_session_history ash where ash.session_id = 1065 group by ash.sql_id order by wait_secs DESC select (select distinct decode( count(distinct sql_text) over (), 1, substr(sql_text,1,80)||'...', 'more than one sql matched' ) from v$sql where sql_id = ash.sql_id) sql, round(sum(ash.wait_time+ash.time_waited)/1000000,2) wait_secs from v$active_session_history ash where ash.session_id = 1065 group by ash.sql_id order by wait_secs DESC select (select distinct decode( count(distinct sql_text) over (), 1, substr(sql_text,1,80)||'...', 'more than one sql matched' ) from v$sql where sql_id = ash.sql_id) sql, round(sum(ash.wait_time+ash.time_waited)/1000000,2) wait_secs from v$active_session_history ash where ash.session_id = 1065 group by ash.sql_id order by wait_secs DESC
And so on… • The possibilities are limitless • Again, please remember • Sampling • More like digital than analog! • Summing up V$ACTIVE_SESSION_HISTORY will never equal tkprof numbers, never equal AWR numbers • But – typically better than good enough • Infinitely better than nothing – go ahead and try to trace the application that wasn’t designed to be traced
AWR - Prepared scripts • In $ORACLE_HOME/rdbms/admin • awrrpt.sql, awrrpti.sql, generate report for pairs of snapshot ids. awrrpti.sql allows you to pick a database, awrrpt.sql defaults to the current database • awrddrpt.sql, awrddrpi.sql, generates a comparison report between two AWR reports. Can be for single database (compare prod at 2pm to prod at 4pm) or for two different databases (compare prod at 2pm to test at 2pm) • awrextr.sql, awrload.sql, (must be connected as sys) – datapump exports/imports AWR data so you can move it to another system for analysis/maintaining a longer history.
AWR - Prepared scripts • In $ORACLE_HOME/rdbms/admin • awrgrpti.sql, awrgrpt.sql, generate RAC aware reports by choosing specific instances to include – or to use all available instances • awrgdrpt.sql, awrgdrpi.sql, generate RAC aware time period comparison reports – within a set of database instances or across databases • awrinfo.sql, (must be connected as sys) to review general AWR information. Tablespace usage, Schema/option usage, Segment usage, snapshot information, retention policies and so on.
AWR - Prepared scripts • In $ORACLE_HOME/rdbms/admin • awrsqrpt.sql, awrsqrpi.sql, generates a report for a single SQL statement over multiple snapshots. Report on plans used, resources used • IO’s • Parses • Executions • CPU/Elapsed times • And more
ASH - Prepared scripts • In $ORACLE_HOME/rdbms/admin • ashrpt.sql, ashrpti.sql, generates an ASH report … filter by • Session • SQL’s • Wait Classes • Database Services • Modules/Actions/Client_ID • PL/SQL entry point • Shows major waits, top services/modules, top clients, SQL activity (parsing, executions, etc), top SQL and more…
ASH - Prepared scripts • In $ORACLE_HOME/rdbms/admin • ashrpti.sql, generates an ASH report. The “I” version filters by • Session • SQL’s • Wait Classes • Database Services • Modules/Actions/Client_ID • PL/SQL entry point • Shows major waits, top services/modules, top clients, SQL activity (parsing, executions, etc), top SQL and more…
AWR – dbms_workload_repository package • Your interface to managing the repository • The scripts we just reviewed – a user interface on top of this package (much like the OEM interface is) • Meaning – you can make your own interface easily • 14 pipelined functions can create any of the previous reports
AWR – dbms_workload_repository package • Other administrative API’s • ADD_COLORED_SQL – to trace a given SQL statement in every snapshot regardless of whether it was considered “top sql” or not. • BASELINE API’s, to create and drop baseline information • SNAPSHOT API’s to drop existing snapshots or modify how often snapshots are taken/retained