Download
1 / 22
220 likes | 378 Vues
EMEP data on the web SR Tables National reports. Michael Gauss. Outline. What kinds of EMEP MSC-W model output can be found on emep.int ? Focus on source-receptor matrices ( SR tables ) Where to find the data? How are these data calculated and how to interpret them?

E N D
EMEP data on the webSR TablesNational reports Michael Gauss
Outline • What kinds of EMEP MSC-W model output can befound on emep.int? • Focus on source-receptor matrices (SR tables) • Where to find the data? • How are these data calculated and how to interpret them? • Focus on national reports (country notes) • Useful country-specific information from EMEP MSC-W forthe parties of CLRTAP
Concentrations and depositions from the EMEP MSC-W model • Type 1) Model results that have been officially reported, based on model simulations using the best available input data at the time of reporting • Type 2) Model results from later re-calculations, using updated input data which were not available at the time of reporting
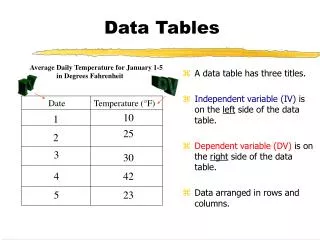
The SR tables Published in the appendices of the EMEP status reports every year
Fundamental questions of LRTAP • Where do the pollutants in a given country or region come from? • Where do the pollutants emitted by a country or region end up?
EMEP MSC-W model runs • The source-receptor (SR) relationships give the change in air concentrations or depositions resulting from a change in emissions from an emitter country • For each of the ≈50 countries, reductions in six different pollutants are calculated separately • 15% reduction in emissions of SOx, NOx, NH3, NMVOC, PPMfine, or PPMcoarse.
Deposition tables • Total contribution from one country to another • Calculated by adding the differences due to a 15% reduction in all emissions from onecountry, multiplied by a factor of 100%/15%
Concentration and indicator tables • The effects of a15% reduction in pollutant emissions are given directly • They should be interpreted as a possible result of emission reduction measures
An example from the EMEP status report 2012 . . . . . . ‘indigenous’ pollution
…a closer look at the bottom of this table . . . . . .
…and the far right . . . . . .
Example: The United Kingdom2010 Emission trends in the UK, various species (2012 data from CEIP); and emissions projected for 2020 (revised Gothenburg protocol). Gg. Spatial distribution of NMVOC emissions from the UK in 2010. Gg.
Sulphur deposition from UK The six main receptor areas where oxidisedsulphur from the UK is deposited. Unit: %. Contribution of emissions from the UK to deposition of oxidisedsulphurin the EMEP domain. Unit: mg(S)/m2.
Transboundary contribution Fraction of transboundary contribution to total sulphur deposition in the UK (%). Same for PPM2.5
Example of an air quality indicator 2009 The six most important contributors to SOMO35 in the UK related to emissions of NOx (left) and NMVOC (right). Unit: %.
Observations! Frequency analysis of ozone in the UK at the stations that reported ozone for 2010 (Model, Observations) ppbv
Conclusions • emep.int has been there for a long time and has a lot to offer (young generation: please have a look and browse!) • «It’s so 2000» : The website is currently restructured to make it more appealing to new users (and even more functional to the old) • Please note that this presentation was onlyabout EMEP MSC-W model results • SR tables are among the key model output from EMEP • country notes are provided to all parties of the Convention (except North America)