Download
1 / 36
360 likes | 370 Vues
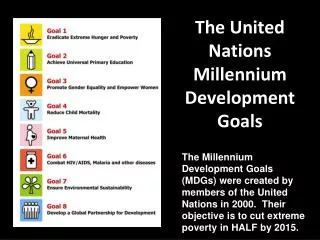
The Millennium Development Goals (MDGs). A Report on the Progress, Shortfalls and Deficit. Rene Raya Social Watch Philippines (SWP). Presentation Outline Background Goals and Targets Poverty Situation Health, Education & the Environment The Financing Gap Global Partnership

E N D
The Millennium Development Goals (MDGs) A Report on the Progress, Shortfalls and Deficit Rene Raya Social Watch Philippines (SWP)
Presentation Outline • Background • Goals and Targets • Poverty Situation • Health, Education & the Environment • The Financing Gap • Global Partnership • Proposals for Mainstreaming the MDGs
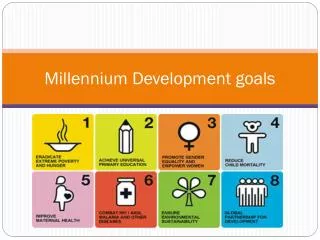
Millennium Development Goals Goals and Targets
Why only 50% reduction in poverty? What happens to the other half? Why 2015? Can the poor wait that long? Who sets the Goals and Targets? Are the MDGs another imposition from Developed Countries to “discipline” Poor Nations? MDG Framework is limited – No mention of Social Justice, Asset Reforms, Power Relations Position Taken by Social Watch Themes adopted by MDG most critical concerns that impact especially on the poor and marginalized Basic Position Supportive of the MDG Framework “MDG PLUS” Questions Raised by Social Watch/ Other Civil Society Groups on the MDG…
AS REPORTED BY NEDA MDG Status at a Glance Chance of Meeting Target Legend: Highr Low hMedium
Poverty Situation Trends, Gaps and Disparities (Goal 1; Target 1)
Social Watch Philippines Report on the MDGs MDG Poverty Target will most likely be met 50% reduction in incidence of extreme poverty between 1990 and 2015 And that is the good news…
Since 1988, virtually no improvement in the Rural Poverty Situation Poverty Headcount – Rural Areas In 1991 55.1%; By 2000 54.5%
Subsistence Incidence by Region While poverty situation has been improving nationally, poverty and subsistence incidence have been increasing in ARMM,CentralMindanao and the Bicol Region and virtually stagnant in Western Mindanao
Deteriorating Poverty Sit’n In fact, of the 79 provinces, only 30 will more likely achieve the MDG target of reducing poverty by half Improving Poverty Sit’n Likely to Achieve MDG Target Provincial Poverty Trends 15 Poorest Provinces • SULU72.7 • MASBATE70.1 • ROMBLON69.3 • MAGUINDANAO67.8 • IFUGAO67.1 • TAWI-TAWI65.3 • CAMARINES NORTE58.1 • LANAO DEL SUR57.1 • SULTAN KUDARAT57.0 • AGUSAN DEL SUR56.2 • MISAMIS OCCIDENTAL55.9 • BOHOL55.6 • OCCIDENTAL MINDORO55.4 • MARINDUQUE54.6 • SARANGANI54.5
Accomplishments in the Health Sector …or some unhealthy trends
On Nutrition (Goal 1/Target #2) Official report on the MDG Probability Low for meeting the target of 50% reduction in malnutrition For Year 2001 Bicol - highest incidence of underweight U5 children (37%), nearly twice compared to NCR Other Poor Raters: Masbate 43.8 Sorsogon 40.6 Antique 42.5 Negros Occ. 42.6 Biliran 44.0 N. Samar 43.4 Bohol 31.9 (1998 data) Among Regions: Bicol 37.8 N. Mindanao 34.1 S. Mindanao 32.3 CARAGA 33.5 Central Vis. 28.3 Available data shows decrease in malnutrition since 1989/90. But trend has been erratic and uneven * Based on FNRI Surveys
On Water Access (Goal 1/Target #3) Nationally, the chance of meeting this target given current trends is high. But again, progress is largely uneven, across regions & provinces. There are provinces where only 30% or less of households have access to safe drinking water: Tawi-Tawi 18.1% Lanao del Sur 22.1% Sulu 30.4% For ARMM 30.6% The following regions will not meet the target set for 2015: • ARMM • Central Mindanao • Southern Mindanao • Western Mindanao • Bicol Among the 15 poorest provinces, only four (BOHOL, Misamis Occidental, Marinduque and Agusan del Sur) have fair chances of meeting the target In fact, about half of the provinces will not likely meet the target of improved access to safe drinking water.
Reducing Under-Five Child Mortality (Goal 4) While nationally, the target of reducing underfive mortality will more likely be met, the same does not hold true for the following regions: All of MindanaoBicolWestern Visayas Improving Maternal Health (Goal 5) Based on current trends, the Philippines not meet the MDG target of reducing MMR by three-fourths, particularly for the following regions (the poorest and highest MMR): All of MindanaoCAR Cagayan Valley Western Visayas *** Eastern Visayas mortality indicators remain high but rate of progress has been significant during the 1990s. “In ARMM, people don’t grow old!!” Life Expectancy at Birth: ARMM 56.6 years // Tawi-Tawi 54.2
Progress, Shortfalls in the Education Sector (Goal 2)
But… “there was a yawning gap in quality, internal efficiency and learning outcomes.” (EFA 2000 Report) The Official Report on the MDGs asserts that universal access to primary education is achievable in the Philippines. Increasing enrolment over the years
Survival Grade 1 Grade 6 4th Yr Efficiency and Quality Learning Achievement NDT NAT Elementary Level 39.99% 43.55% High School Level 28.04% 36.13% ___________________________ SY 2002-2003
Efficiency & Learner Outcomes… 312 drop 1000 Grade 1 entrants 439 will finish in 6 yrs 249 will finish in 9.6 yrs Only 7 will have 75% scores in Science, Math, English
Switzerland Cavite Japan Batangas Greece Cambodia Uganda Lao Performing Provinces Congo Nepal LDCs (Average) Thailand Disparity in Education Performance UNDP’s Education Index (HDI) Chile 0.90 Bohol Philippines Cebu 0.80 Leyte 0.70 Average for 10 lowest 0.60 ARMM SULU/BASILAN 0.50 0.40 Some of the poorest provinces in the country perform no better than the world’s poorest
Country EDI Ranking 0 5 10 15 20 25 30 35 40 45 50 55 60 65 70 Argentina Chile Jordan Thailand Indonesia Vietnam China Tunisia Philippines Myanmar Cambodia ON EFA The EFA Development Index (EDI) UNESCO Global Monitoring Report (2003/04)
Environmental Sustainability Index (ESI) - 2002 Philippines got poor ESI rating: * Rank 117th of 142Countries. In terms of Enviromental Systems: * Phils was ranked 3rd to the last. In fairness, the country received average marks for Reducing “Environmental Stresses” and “Human Vulnerability”. ESI Measure of progress towards environmental sustainability developed for 142 countries based on 20 core indicators (68 variables). Yale and Columbia University Brief Note on Environmental Sustainability (Goal #7) “The country’s natural resource base remains under threat.”(NEDA Report) “… a question of equity and justice.”(Social Watch) *** Unequal access to, control and use of natural resources *** Vulnerability of the poor to environmental hazards and disasters, and their crippling impact on peoples livelihood
To summarize again the MDG Status – this time with the Regional and Provincial Breakdowns…
Chance of Meeting Target MDG Status at a Glance * Social Watch estimates based on Regional Trends Legend: Highr Low hMedium
The Financing Shortfall
Mobilizing adequate resources is imperative to ensure attainment of the Millennium Development Goals and specific targets by 2015!!!
Dr. Manasan Study (UNDP) Total Resource Gap (2002-2006) to meet MDG Targets (Education, Health, WatSan) That means an additional 5.9% of the National Budget. Given these figures, it is not likely to to meet MDG targets, unless more resources are generated 229 Billion THE DEBTBURDEN
Allocation for servicing the country’s external debt is significantly higher than the combined allocation for health and education. Debt Service
Per Capita Health Expenditure: 1990 313.73/person 2003 152.33/person • According to WHO, RP ranks among the last (161st) in terms of health spending (Total Health expenditure as % of GDP) • Result: RP ranks 126th in terms of overall “level of health” Current Education Expenditure: P4,000 to 5,000 per elementary student Since 1998, real per capita spending on education has been declining! In fact, today’s per pupil spending in real terms is about the same level as in 1978! CURRENT LEVEL OF EXPENDITURE CANNOT BUY QUALITY HEALTH AND QUALITY EDUCATION
The gap of P 229 Billion is just about 10% of total external debt World Bank study estimates that P 48B is lost annually to corruption. This amount is just about what is needed to cover the resource gap in meeting MDG Targets!!! Is it possible to cover the financing Gap?
Global Partnership for Development
The series of world conferences in the 1990s culminated in the Millennium Summit (Sept 2000) affirmed commitments to increase development assistance, deal comprehensively with the debt problems and work for nondiscriminatory trading and financial system.
Official Development Assistance (ODA) Overall World Trend Sharp decline in ODA, especially in the 1990s, indicating the developed countries are becoming “richer and meaner” Source: Reality of Aid, 2002 Only five donors meet the UN 0.7% target for aid as share of GNI: Denmark, Norway, Netherlands, Luxembourg and Sweden
ODA and Agricultural Subsidies $ In 2000, cows and cotton got more aid than people!!! _____________ (HDR 2003, UNDP) $
Debt Situation Current figures and trend indicate that external debt of poor developing and transitional economies had been increasing. Limited resources are channeled to service external debt, crippling the economies of many developing countries Share in World Export International Trade Initial data indicate worsening terms of trade in most developing developing countries in recent years, indicating that trade agreements may have not been procedurally-fair and outcome-fair
? TANONG LANG… HAVE WE BEEN TAKEN FOR A RIDE!!! Net Transfers of Financial Resources US$192.5 Bn Outflow of financial resources – Year 2002 North Since 1998, financial resources are flowing out of developing economies. South
Immediate Recommendations Mainstream MDG in development planning and budgeting Review MDG targets based on particular situation and adopt appropriate policies and strategies to achieve tbe MDGs Enhance local capacity in monitoring the MDGs Improve the local statistical system to include generation of all MDG-related data disaggregated by sex & location; address the availability, completeness, & reliability of all MDG-related data Tap Donor Community to support projects that aim to achieve the MDGs Strengthen partnerships between government and civil society