Download
1 / 1
10 likes | 175 Vues
MS-Viewer – A Web Based Spectral Viewer For Database Search Results Peter R. Baker 1 , Alma L. Burlingame 1 and Robert J. Chalkley 1 1 Mass Spectrometry Facility, Dept. of Pharmaceutical Chemistry, University of California, San Francisco, USA. Introduction. MS-Viewer Form.

E N D
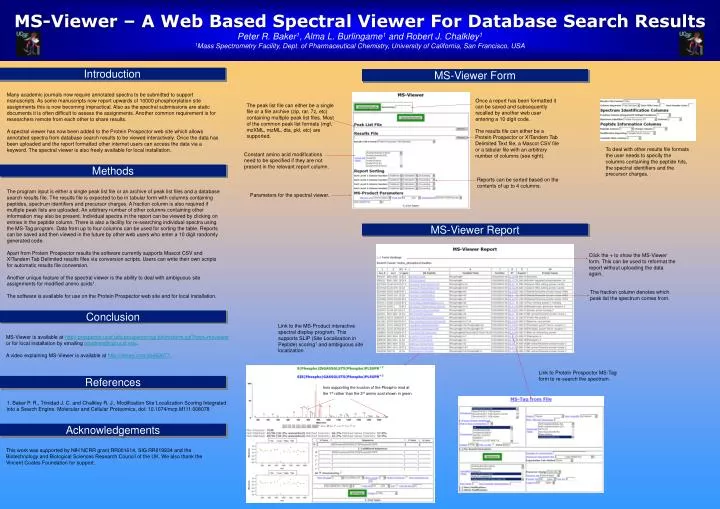
MS-Viewer – A Web Based Spectral Viewer For Database Search Results Peter R. Baker1, Alma L. Burlingame1 and Robert J. Chalkley1 1Mass Spectrometry Facility, Dept. of Pharmaceutical Chemistry, University of California, San Francisco, USA Introduction MS-Viewer Form Many academic journals now require annotated spectra to be submitted to support manuscripts. As some manuscripts now report upwards of 10000 phosphorylation site assignments this is now becoming impractical. Also as the spectral submissions are static documents it is often difficult to assess the assignments. Another common requirement is for researchers remote from each other to share results. A spectral viewer has now been added to the Protein Prospector web site which allows annotated spectra from database search results to be viewed interactively. Once the data has been uploaded and the report formatted other internet users can access the data via a keyword. The spectral viewer is also freely available for local installation. Once a report has been formatted it can be saved and subsequently recalled by another web user entering a 10 digit code. The peak list file can either be a single file or a file archive (zip, rar, 7z, etc) containing multiple peak list files. Most of the common peak list formats (mgf, mzXML, mzML, dta, pkl, etc) are supported. The results file can either be a Protein Prospector or X!Tandem Tab Delimited Text file, a Mascot CSV file or a tabular file with an arbitrary number of columns (see right). To deal with other results file formats the user needs to specify the columns containing the peptide hits, the spectral identifiers and the precursor charges. Constant amino acid modifications need to be specified if they are not present in the relevant report column. Methods Reports can be sorted based on the contents of up to 4 columns. The program input is either a single peak list file or an archive of peak list files and a database search results file. The results file is expected to be in tabular form with columns containing peptides, spectrum identifiers and precursor charges. A fraction column is also required if multiple peak lists are uploaded. An arbitrary number of other columns containing other information may also be present. Individual spectra in the report can be viewed by clicking on entries in the peptide column. There is also a facility for re-searching individual spectra using the MS-Tag program. Data from up to four columns can be used for sorting the table. Reports can be saved and then viewed in the future by other web users who enter a 10 digit randomly generated code. Apart from Protein Prospector results the software currently supports Mascot CSV and X!Tandem Tab Delimited results files via conversion scripts. Users can write their own scripts for automatic results file conversion. Another unique feature of the spectral viewer is the ability to deal with ambiguous site assignments for modified amino acids1. The software is available for use on the Protein Prospector web site and for local installation. Parameters for the spectral viewer. MS-Viewer Report Click the + to show the MS-Viewer form. This can be used to reformat the report without uploading the data again. The fraction column denotes which peak list the spectrum comes from. Conclusion Link to the MS-Product interactive spectral display program. This supports SLIP (Site Localization in Peptide) scoring1 and ambiguous site localization. MS-Viewer is available at http://prospector.ucsf.edu/prospector/cgi-bin/msform.cgi?form=msviewer or for local installation by emailing ppadmin@cgl.ucsf.edu. A video explaining MS-Viewer is available at http://vimeo.com/30462677. Link to Protein Prospector MS-Tag form to re-search the spectrum. References Ions supporting the location of the Phospho mod at the 1st rather than the 3rd amino acid shown in green. 1. Baker P. R., Trinidad J. C. and Chalkley R. J., Modification Site Localization Scoring Integrated into a Search Engine. Molecular and Cellular Proteomics, doi: 10.1074/mcp.M111.008078 Acknowledgements This work was supported by NIH NCRR grant RR001614, SIG RR019934 and the Biotechnology and Biological Sciences Research Council of the UK. We also thank the Vincent Coates Foundation for support.