Download
1 / 1
20 likes | 181 Vues
Combining spectral and intensity data to identify regions of cavitation in ultrasound images; application to HIFU. Chang-yu Hsieh 1 , Penny Probert Smith 1 , Tom Leslie 2 , James Kennedy 2 , Fares Mayia 3 and Gouliang Ye 1

E N D
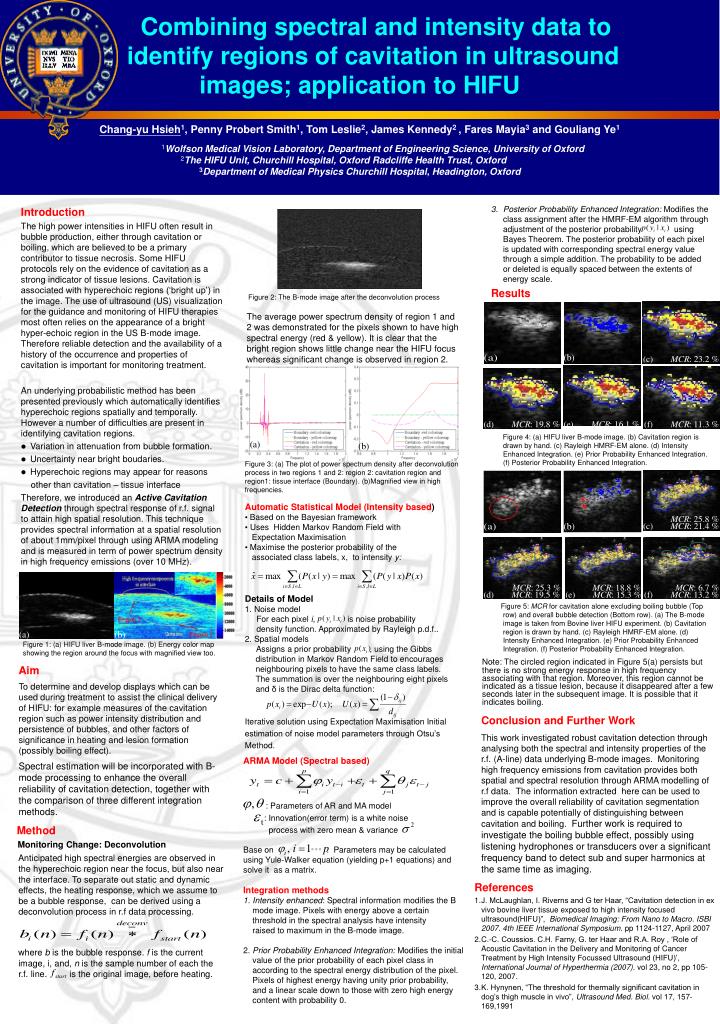
Combining spectral and intensity data to identify regions of cavitation in ultrasound images; application to HIFU Chang-yu Hsieh1, Penny Probert Smith1, Tom Leslie2, James Kennedy2 , Fares Mayia3 and Gouliang Ye1 1Wolfson Medical Vision Laboratory, Department of Engineering Science, University of Oxford 2The HIFU Unit, Churchill Hospital, Oxford Radcliffe Health Trust, Oxford 3Department of Medical Physics Churchill Hospital, Headington, Oxford • Posterior Probability Enhanced Integration: Modifies the class assignment after the HMRF-EM algorithm through adjustment of the posterior probability using Bayes Theorem. The posterior probability of each pixel is updated with corresponding spectral energy value through a simple addition. The probability to be added or deleted is equally spaced between the extents of energy scale. • Results • Figure 4: (a) HIFU liver B-mode image. (b) Cavitation region is drawn by hand. (c) Rayleigh HMRF-EM alone. (d) Intensity Enhanced Integration. (e) Prior Probability Enhanced Integration. (f) Posterior Probability Enhanced Integration. • Figure 5: MCR for cavitation alone excluding boiling bubble (Top row) and overall bubble detection (Bottom row). (a) The B-mode image is taken from Bovine liver HIFU experiment. (b) Cavitation region is drawn by hand. (c) Rayleigh HMRF-EM alone. (d) Intensity Enhanced Integration. (e) Prior Probability Enhanced Integration. (f) Posterior Probability Enhanced Integration. • . • Introduction • The high power intensities in HIFU often result in bubble production, either through cavitation or boiling, which are believed to be a primary contributor to tissue necrosis. Some HIFU protocols rely on the evidence of cavitation as a strong indicator of tissue lesions. Cavitation is associated with hyperechoic regions (‘bright up’) in the image. The use of ultrasound (US) visualization for the guidance and monitoring of HIFU therapies most often relies on the appearance of a bright hyper-echoic region in the US B-mode image. Therefore reliable detection and the availability of a history of the occurrence and properties of cavitation is important for monitoring treatment. • An underlying probabilistic method has been presented previously which automatically identifies hyperechoic regions spatially and temporally. However a number of difficulties are present in identifying cavitation regions. • Variation in attenuation from bubble formation. • Uncertainty near bright boudaries. • Hyperechoic regions may appear for reasons • other than cavitation – tissue interface • Therefore, we introduced an Active Cavitation Detection through spectral response of r.f. signal to attain high spatial resolution. This technique provides spectral information at a spatial resolution of about 1mm/pixel through using ARMA modeling and is measured in term of power spectrum density in high frequency emissions (over 10 MHz). Figure 2: The B-mode image after the deconvolution process The average power spectrum density of region 1 and 2 was demonstrated for the pixels shown to have high spectral energy (red & yellow). It is clear that the bright region shows little change near the HIFU focus whereas significant change is observed in region 2. Figure 3: (a) The plot of power spectrum density after deconvolution process in two regions 1 and 2: region 2: cavitation region and region1: tissue interface (Boundary). (b)Magnified view in high frequencies. Automatic Statistical Model (Intensity based) • Based on the Bayesian framework • Uses Hidden Markov Random Field with Expectation Maximisation • Maximise the posterior probability of the associated class labels, x, to intensity y: Details of Model 1. Noise model For each pixel i,is noise probability density function. Approximated by Rayleigh p.d.f.. 2. Spatial models Assigns a prior probability , using the Gibbs distribution in Markov Random Field to encourages neighbouring pixels to have the same class labels. The summation is over the neighbouring eight pixels and δ is the Dirac delta function: Iterative solution using Expectation Maximisation Initial estimation of noise model parameters through Otsu’s Method. Figure 1: (a) HIFU liver B-mode image. (b) Energy color map showing the region around the focus with magnified view too. Note: The circled region indicated in Figure 5(a) persists but there is no strong energy response in high frequency associating with that region. Moreover, this region cannot be indicated as a tissue lesion, because it disappeared after a few seconds later in the subsequent image. It is possible that it indicates boiling. Aim To determine and develop displays which can be used during treatment to assist the clinical delivery of HIFU: for example measures of the cavitation region such as power intensity distribution and persistence of bubbles, and other factors of significance in heating and lesion formation (possibly boiling effect). Spectral estimation will be incorporated with B-mode processing to enhance the overall reliability of cavitation detection, together with the comparison of three different integration methods. Conclusion and Further Work This work investigated robust cavitation detection through analysing both the spectral and intensity properties of the r.f. (A-line) data underlying B-mode images. Monitoring high frequency emissions from cavitation provides both spatial and spectral resolution through ARMA modelling of r.f data. The information extracted here can be used to improve the overall reliability of cavitation segmentation and is capable potentially of distinguishing between cavitation and boiling. Further work is required to investigate the boiling bubble effect, possibly using listening hydrophones or transducers over a significant frequency band to detect sub and super harmonics at the same time as imaging. ARMA Model (Spectral based) : Parameters of AR and MA model : Innovation(error term) is a white noise process with zero mean & variance Base on . Parameters may be calculated using Yule-Walker equation (yielding p+1 equations) and solve it as a matrix. Integration methods 1. Intensity enhanced: Spectral information modifies the B mode image. Pixels with energy above a certain threshold in the spectral analysis have intensity raised to maximum in the B-mode image. 2. Prior Probability Enhanced Integration: Modifies the initial value of the prior probability of each pixel class in according to the spectral energy distribution of the pixel. Pixels of highest energy having unity prior probability, and a linear scale down to those with zero high energy content with probability 0. Method Monitoring Change: Deconvolution Anticipated high spectral energies are observed in the hyperechoic region near the focus, but also near the interface. To separate out static and dynamic effects, the heating response, which we assume to be a bubble response, can be derived using a deconvolution process in r.f data processing. where b is the bubble response. f is the current image, i, and, n is the sample number of each the r.f. line. is the original image, before heating. • References • J. McLaughlan, I. Riverns and G ter Haar, “Cavitation detection in ex vivo bovine liver tissue exposed to high intensity focused ultrasound(HIFU)”, Biomedical Imaging: From Nano to Macro. ISBI 2007. 4th IEEE International Symposium. pp 1124-1127, April 2007 • C.-C. Coussios. C.H. Farny, G. ter Haar and R.A. Roy , ‘Role of Acoustic Cavitation in the Delivery and Monitoring of Cancer Treatment by High Intensity Focussed Ultrasound (HIFU)’, International Journal of Hyperthermia (2007). vol 23, no 2, pp 105-120, 2007. • K. Hynynen, “The threshold for thermally significant cavitation in dog’s thigh muscle in vivo”, Ultrasound Med. Biol. vol 17, 157-169,1991