Download
1 / 52
520 likes | 635 Vues
Research Experience for Undergraduates (REU) in Statistics at Miami University. Vasant B. Waikar, Miami University Oxford, OH, USA waikarvb@muohio.edu. REU ( Research Experience for Undergraduates ) in Statistics at Miami University.

E N D
Research Experience for Undergraduates (REU) in Statistics at Miami University Vasant B. Waikar, Miami University Oxford, OH, USA waikarvb@muohio.edu
REU (Research Experience for Undergraduates) in Statistics at Miami University • In this paper I will describe the working of this REU named the Summer Undergraduate Mathematical Sciences Research Institute or SUMSRI that I have directed for the last nine summers at Miami University. SUMSRI is funded by the National Security Agency (NSA) and the National Science Foundation (NSF). I will also discuss the nature and content of the research papers written by the undergraduates at this REU under my supervision. Some of these papers have won awards in the student paper competition sponsored by the American Statistical Association (ASA). • Keywords: Research Experience for Undergraduates, Statistics
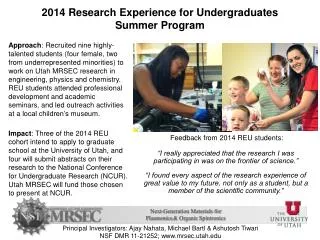
SUMSRI-Summer Undergraduate Mathematical Sciences Institute at Miami University, Oxford, OH (1999-present) • Supported by the NSF, NSA and Miami Univ. • Seven weeks (June-July) • Underrepresented minority students & women SUMSRI Faculty & Students-2008
Statistics on Mathematical Scientists • In Spring 2006, 1245 Ph.D.’s in Mathematical Sciences • 522 Math Ph.D.’s to US citizens • 17 Math Ph.D.’s to African Americans • 17 Math Ph.D.’s to Hispanics • 143 Math Ph.D.’s to women
Objectives of SUMSRI • To encourage 12-15 US participants to get Ph.D in math or related area • To smooth the transition between undergraduate and graduate school • To provide information on graduate school applications and finances • To provide mentors and role models
Programs that Make a Difference • SUMSRI won the “Programs that Make a Difference” Award from the American Mathematical Society in 2008.
What SUMSRI Offers • Short courses in Analysis and Algebra • Mathematical Writing course • GRE Preparation course • Research seminars in Math and Statistics • Two colloquia per week by minority and female mathematicians and statisticians • Graduate school panel discussion • Students present their work to the department and submit a paper. (See their papers at http://www.users.muohio.edu/porterbm/sumj/ Journal.html)
Personnel Directors: Dennis Davenport and Vasant Waikar Thomas Farmer, Mathematical Writing Not pictured: Dennis Keeler, Algebraic Topology, & Dennis Davenport: GRE Prep Patrick Dowling (Real Analysis) & Bonita Porter, Program Coordinator Research Seminar Directors: Edray Goins, Vasant Waikar & Reza Akhtar
List of Personnel—2006 • Program Co-directors —Dr. Dennis Davenport • —Dr. Vasant Waikar • Program Coordinator —Ms. Bonita Porter • Algebra Short Course —Dr. Dennis Keeler • Analysis Short Course —Dr. Patrick Dowling • GRE Instruction —Dr. Dennis Davenport • Mathematical Writing —Dr. Thomas Farmer • Computer Expert —Dr. Dennis Burke • Research Seminar Directors: • Algebra —Dr. Reza Akhtar • Number Theory —Dr. Edray Goins • Statistics —Dr. Vasant Waikar • With the exception of the Number Theory seminar director, Dr. Goins, who came from Purdue, everyone else is from Miami University, Math and Statistics Department.
Statistical Research Seminar • Pre-requisites • Instruction • Locating data set • Analyzing data & writing paper • Presenting research
Past Statistical Research Papers • 1999 • Do Students in Mathematics and the Sciences at Miami University Cheat on Exams Using Graphing Calculators?: An Unrelated-Question Randomized Response Experiment Lynn Holmes, Fayetteville State University Bethany Lyles, Fort Lewis College • The Change in the Number of Four-letter Words in the English Language Rachel Kahlenberg, Ohio Northern University Rebekkah Dann, Messiah College
2000 • Multivariate Classification Methods: The Prevalence of Sexually Transmitted Diseases Candace Porter, Albany State University Michael Sotelo, California Polytechnic— Pomona Brandon McKenzie, Centre College Lindsay Kellam, Queens College
2001 • A Multivariate Statistical Analysis of State Desirability Jennifer Everson, Carthage College Melissa Hildt, College of Notre Dame of Maryland Jason Popovic, Baldwin-Wallace College Sarah Zimmermann, Bemidji State University
2002 • A Multivariate Statistical Analysis of the Free World David Friedenberg, Miami University Shenek Heyward, Francis Marion University • Multivariate Analysis of Vehicle Safety Leigh Cobbs, Texas A&M University Mary Cunnigham, James Madison University Cheryl Gerde, Morehead State University
2003 • A Multivariate Statistical Analysis of Stock Trends April Kerby, Alma College James Lawrence, Miami UniversityA Multivariate Statistical Analysis of the NBA Lori Hoffman, University of Wisconsin, River Falls Maria Joseph, Kentucky State University
2004 • Educating the States: A Multivariate Statistical Analysis of Education • Nick Imholte, Xavier University, Cincinnati • Sara Blight, University of Arizona, Tucson • A Multivariate Statistical Analysis of Crime Rate in US Cities • Kendall Williams, Howard University • Ralph Gedeon, University of Florida
2005 • A Multivariate Statistical Analysis of Substance Abuse in the United States • Joshua Svenson, Baldwin-Wallace College • Monique Owens, Central State University • A Multivariate Statistical Analysis of Female Empowerment • Janelle Jones, Spelman College • AdriAnne Demski, Clarion University
2006 • Reckless or Responsible: A Multivariate Statistical Analysis of Consumer Spending Emilola Abayomi, Albany State University Erin Esp, Montana Tech Shannon Grant, University of Idaho • Education By Nation: A Multivariate Statistical Analysis Ashley Brooks, Winston Salem State University Amber Shoecraft, Johnson C. Smith University Anthony Franklin, Coastal Carolina University
2007 • College Desirability: A Multivariate Statistical Analysis Andrea M. Austin, St. Michael's College Terrell A. Felder, North Carolina A & T Lindsay M. Moomaw, Baldwin-Wallace College • Risky Behavior: A Multivariate Statistical Analysis of the United States Based on Health Risk FactorsChristina McIntosh, Spelman CollegeAlicia Smith, Winston-Salem State UniversityAshley Swandby, Longwood University
Multivariate Statistics 1999 Rebecca Dann and Lynn Holmes give their final presentations.
Do Students in Mathematics and the Sciences at Miami University Cheat on Exams Using Graphing Calculators?: An Unrelated-Question Randomized Response Experiment • ByLynn Holmes, Fayetteville State University and Bethany Lyles, Fort Lewis College • We used the randomized response method to look at how many students might cheat on tests using graphing calculators. Graphing calculators allow students to perform tedious mathematical calculations with great ease and considerably shorten the amount of time needed to work some difficult problems. However, it is possible to store information, such as formulas or definitions, in graphing calculators and use this information to cheat on exams. In order to address this issue, an unrelated-question randomized response experiment was conducted at Miami University in Oxford, Ohio. To compare the percentages of students that have cheated on exams using graphing calculators among different departments, samples were taken from among mathematics, chemistry, and physics students. The unrelated-question randomized response method applies to this situation because some people may feel uncomfortable responding truthfully to direct statements regarding sensitive issues, such as cheating on exams. Relative to standard randomized response, this method yields a smaller variance. The smaller variance given by the unrelated-question randomized response method allows a shorter confidence interval to be constructed.
The Change in the Number of Four-letter Words in the English Language • ByRachel Kahlenberg, Ohio Northern University and Rebekkah Dann, Messiah College • Abstract: The English language is constantly changing, but it is almost impossible to detect all of those changes without choosing a specific area of study. Because four letter words are an integral and sometimes interesting part of the English language, it is worthwhile to contemplate whether their use has changed over the past few decades. However, the task of counting the number of four-letter words would be very time consuming, but through the use of statistical sampling, the time this takes is considerably reduced.
Multivariate Classification Methods: The Prevalence of Sexually Transmitted Diseases • By Candace Porter, Albany State University; Michael Sotelo, California Polytechnic—Pomona; Brandon McKenzie, Centre College and Lindsay Kellam, Queens College • Abstract: We took a statistical look at the spread of sexually transmitted diseases. Each year, thousands of federal and state dollars are allocated for STD education programs, medical treatments, and preventative measures. We used the STD situation to illustrate how multivariate classification methods can be used. First, we used principal component analysis to simplify the interpretation and summary of those variables which aid in predicting STD rates. Principal component analysis allowed us to depict a set of data using a number of descriptive factors that was less than the number of variables. We began with measurements of ten racial, ethnic, socioeconomic, and educational variables for each case and were able to combine them into four components that provide a clearer picture of the factors that predict the rate of STDs. Second, using discriminant analysis, we created a model that consisted of two groups: a group with a high rate of STDs and another with a low rate of STDs. Members (cases) in each group share similar racial, ethnic, socioeconomic, and educational variables. Using this discriminant model, we can predict an unknown observation's group classification.
A Multivariate Statistical Analysis of State Desirability • By Jennifer Everson, Carthage College; Melissa Hildt, College of Notre Dame of Maryland; Jason Popovic, Baldwin-Wallace College and Sarah Zimmermann, Bemidji State University • Abstract: We determined the desirability of living in any state by using a set of several different variables. The multivariate statistical methods of factor analysis and discriminant analysis lend themselves to this issue. We used factor analysis to reduce a large number of variables to a smaller set of common factors which describe state desirability. We then used discriminant analysis to classify states according to their desirability level based on a set of measured variables.
A Multivariate Statistical Analysis of the Free World • By David Friedenberg, Miami University and Shenek Heyward, Francis Marion University • Abstract: Is a democracy more than just competitive multiparty elections in which all participants have a legitimate chance of attaining power? Using such statistical analyses processes such as discriminant analysis and factor analysis, we hope to determine a rule for classifying countries from a sample into one of two groups, democratic or non-democratic. We also hope to reduce our data from 11 variables to a smaller set of underlying factors that can be used to explain the dynamics surrounding each country.
Multivariate Analysis of Vehicle Safety • By Leigh Cobbs, Texas A&M University; Mary Cunningham, James Madison University and Cheryl Gerde, Morehead State University • Abstract: Vehicle safety affects our lives daily. To measure safety, we took a large sample of popular vehicles and set out to create a vehicle safety rating system. To do this, we used two multivariate techniques, Principal Components Analysis and Discriminant Analysis. Principal Components Analysis reduced our set of variables to a smaller set of principal components. We then used Discriminant Analysis to classify vehicles by safety rating using principal components scores.
A Multivariate Statistical Analysis of the NBA • By Lori Hoffman, University of Wisconsin River Falls and Maria Joseph, Kentucky State University • Abstract: Will your favorite National Basketball Association (NBA) team make it to the playoffs this year? What variables affect a team’s postseason outcome? In an attempt to determine which teams will make the NBA playoffs, we will collect and analyze team data using multivariate statistical methods including Principal Components Analysis and Discriminant Analysis.
A Multivariate Statistical Analysis of Stock Trends • By: April Kerby, Alma College and James Lawrence, Miami University • Abstract: Is there a method to predict the stock market? What factors determine if a company’s stock value will rise or fall in a given year? Using the multivariate statistical methods of principal component analysis and discriminant analysis, we aim to determine an accurate method for classifying a company’s stock as a good or a poor investment choice. Additionally, we will explore the possibilities for reducing the dimensionality of a complex financial and economic dataset while maintaining the ability to account for a high percentage of the overall variation in the data.
Educating the States: A Multivariate Statistical Analysis of Education • By: Nick Imholte, Xavier University, Cincinnati and Sara Blight, University of Arizona, Tucson • Abstract: Educating the population is important in every state. To measure the quality of education in a state, we examine average Scholastic Aptitude Test scores. We create a model to predict future scores based on variable that affect education. First, we use the multivariate statistical methods of Principal Component Analysis and Factor Analysis to reduce the number of variables. Second, we use both of these methods in conjunction with Discriminant Analysis to create a model that predicts future scores. Finally, we use the results of Discriminant Analysis to conjecture how to improve the quality of education.
A Multivariate Statistical Analysis of Crime Rate in US Cities • By: Kendall Williams, Howard University and Ralph Gedeon, University of Florida • We classify a city as safe or unsafe by using multivariate methods of Principal Components, Factor Analysis, and Discriminant Analysis. In addition, we discover which variables have salience in the identification of a city being safe or dangerous. The fore mentioned analytical techniques can assist city governments in finding out what variables they need to change to improve their state or city and make it a better place to live.
A Multivariate Statistical Analysis of Substance Abuse in the United States • Joshua Svenson, Baldwin-Wallace Collegeand Monique Owens, Central State University • Where do the major drug problems occur in this country among the states? How are social and economic factors related to substance abuse in the states? We approach these questions with multivariate statistics. By using factor analysis, we distinguish the underlying factors of a collection of variables related to substance abuse. With discriminant analysis, we design a rule for classifying states as either having a major drug problem or minor drug problem.
A Multivariate Statistical Analysis of Female Empowerment • Janelle Jones, Spelman Collegeand AdriAnne Demski, Clarion University • As women of the world struggle for equality there is a need for ways of measuring progress. We explore the empowerment of women using multivariate statistical techniques such as factor analysis and discriminant analysis. We hope to classify countries into two populations, one where women are empowered and the other where women are not. We simplify this process by reducing the dimensionality of the data from 13 variables to a smaller collection of underlying factors.
Education By Nation: A Multivariate Statistical Analysis • Ashley Brooks, Winston Salem State University, Amber Shoecraft, Johnson C. Smith University, and Anthony Franklin, Coastal Carolina University • We analyze education systems of 64 countries using multivariate statistical techniques such as principal component analysis, factor analysis, and discriminant analysis. Our goal is to classify countries into two populations, one where the educational system of the country is exceptional and the other where the educational system is fair. Reducing the dimensionality of the data set simplifies this process. “Education is our passport to the future, for tomorrow belongs to the people who prepare for it today.”-- Malcolm X
Reckless or Responsible: A Multivariate Statistical Analysis of Consumer Spending • Emilola Abayomi, Albany State University, Erin Esp, Montana Tech and Shannon Grant, University of Idaho • As Americans spend more and save less, there is a need to evaluate variables which influence spending habits. First, we reduce the number of variables with Principal Components analysis and identify underlying factors by grouping correlated variables in Factor Analysis. Finally, we use Discriminant Analysis to develop a rule for classifying individual consumers as either reckless or responsible spenders.
College Desirability: A Multivariate Statistical Analysis • By Andrea M. Austin, Terrell A. Felder, Lindsay M. Moomaw • The colleges and universities across the United States are all unique. To quantify how institutions of all sizes measure up, multivariate techniques of Principal Component Analysis, Factor Analysis, and Discriminant Analysis are used fittingly and effectively, producing a valid, unbiased evaluation of each school, and also a model to gauge any chosen seminary. The method of Principal Components reduces the number of variables, focusing on those with efficacy while Factor Analysis provides a data reduction to explain the variability of the college or university statistics. Finally, a Discriminant Analysis of the data classifies the schools and establishes a method of accurate prediction. • Directed by Dr. Vasant Waikar, with graduate assistant, Kevin Tolliver
Risky Behavior: A Multivariate Statistical Analysis of the United States Based on Health Risk Factors • By Christina McIntosh, Alicia Smith, Ashley Swandby • Under the direction of Dr. Vasant Waikar and graduate assistant, Kevin Tolliver, Christina, Alicia and Ashley studied a number of variables associated with health risk factors in the United States. They used the 2006 Centers for Disease Control’s Behavioral Risk Factor Surveillance System survey data to analyze each state based on these variables. They used Principal Component Analysis, Factor Analysis, and Discriminant Analysis in order to analyze the multivariate data. Furthermore, they provided a ranking of relative health for some of the states based on the analysis.
Outcomes and Conclusions • 129 total participants • 18.5% are still undergraduates • 70% are either in grad school or hold graduate degree • Remainder are in education, government and private business, including banking, insurance, cancer research and defense research
Awards • Several papers received awards at the American Mathematical Society Annual Meetings • One statistical paper won a student award at the Joint Statistical Meetings in competition with Ph.D. students Shenek Heyward works on her award winning paper with David Friedenberg
Results for Minority Students • 64 minority participants • 51 now hold bachelor degrees • 44 in graduate school or have graduate degree
Results for Women • 99 female participants • 82 have graduated • 69 in graduate programs or hold graduate degree Women of SUMSRI 2007