Download

1 / 9
90 likes | 196 Vues
Studying Magnetic Field Reorganisation in Flares Using Hard X-ray and UV Data. Lyndsay Fletcher University of Glasgow. Footpoints – tracers of magnetic field evolution Ribbon structure and footpoint motions Footpoint intensity variations. Flare Footpoints.

E N D
Studying Magnetic Field Reorganisation in Flares Using Hard X-ray and UV Data Lyndsay Fletcher University of Glasgow • Footpoints – tracers of magnetic field evolution • Ribbon structure and footpoint motions • Footpoint intensity variations
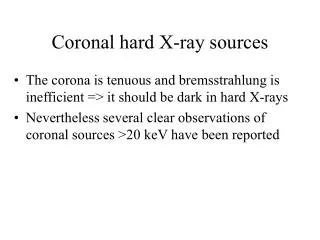
Flare Footpoints • As reconnection progresses in the corona, the footpoints of ‘just • reconnected’ fieldlines are illuminated (by particles / conduction) • This leads to the appearance of footpoints (HXR) or flare ribbons (H, UV/EUV), which ‘move’ through the magnetic field as the flare proceeds
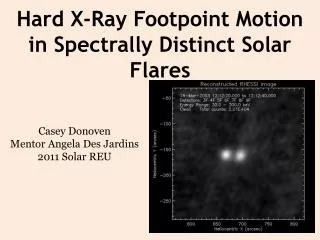
RHESSI Observations RHESSI Hard X-rays provide a very direct signature of fast electrons when they reach the chromosphere HXR sources separate, moving along the ribbons UV ribbons much more extended than HXR sources – observational limitation? Location of main source centroids 14 March 2002, 8s integrations
Separatrix intersections Magnetic topology and accelerated particles • Coronal field evidently more complicated than 2-D models. Footpoint sources may assist in constraining field evolution. • Metcalf et al. (2003) show location of HXR and white-light sources with • respect to calculated intersection of potential field magnetic separatrix • surfaces with photosphere. Time evolution of HXR footpoint positions
UV / EUV footpoints High resolution (and unsaturated) TRACE UV/EUV observations from the impulsive phase show emission ‘fragmented’ along length of ribbon on scales as small as 2”. Observation cadence as low as 2s. Pixels are ~ 0.”5 x 0.”5 What can be learned by tracking these footpoints?
I1600 I1600 v BLOS v BLOS UV footpoint source intensity variations UV footpoints flicker on and off; time correlations exist often between distant pairs (but often not between near neighbours). Peaks in the product v BLOS for individual footpoints fairly well correlated in time with peaks in the UV brightness (~50% of fp brightenings occur within ± 10s of vBLOS peak; Monte Carlo simulations with random vBLOS peak locations give about 25% association)
By correlating footpoint intensity variations, can find pairs of locations • that are possibly linked in some way: • direct magnetic connection (+ve correlated with –ve) • via a null? (+ve correlated with +ve) (See also work on correlations in H alpha ribbons by Asai)
Questions: Why do we typically only see a couple of HXR sources but more extended (and complicated) UV separatrices? What is special about these locations? Can we relate spatial fragmentation of the ribbons to fragmentation of the reconnection region (albeit within a larger-scale organising structure)? Can we usefully provide limits to geometry in which acceleration mechanisms must operate (e.g. loop lengths – cf Miller review)