Download
1 / 34
340 likes | 444 Vues
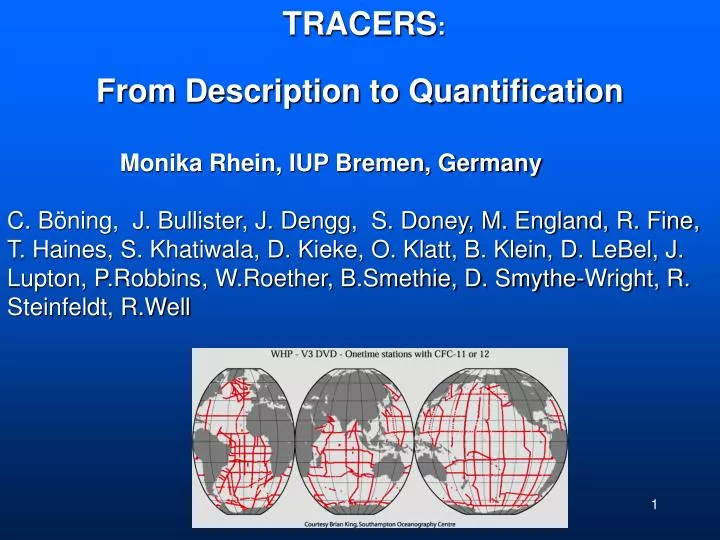
TRACERS : From Description to Quantification Monika Rhein, IUP Bremen, Germany

E N D
TRACERS: From Description to Quantification Monika Rhein, IUP Bremen, Germany C. Böning, J. Bullister, J. Dengg, S. Doney, M. England, R. Fine, T. Haines, S. Khatiwala, D. Kieke, O. Klatt, B. Klein, D. LeBel, J. Lupton, P.Robbins, W.Roether, B.Smethie, D. Smythe-Wright, R. Steinfeldt, R.Well
Formationof Deep and Bottom Water A New Deep Water Mass in Drake Passage Ventilation of the Pacific Tracer ages: what do they tell us? Conclusion / Outlook
AABW is formed : western Weddell Sea, western and eastern Ross Sea, Adelie Coast, Amery Ice Shelf
CFC-11 along 0°E, 1984 - 1998 2 deep CFC cores in AABW Klatt,Roether,Hoppema,Bulsie wicz,Fleischmann,Rodehacke, Fahrbach,Weiss,Bullister, JGR, 107, 2002
Estimates of AABW Production Rates WSBW from DWBC transports : 2-5 Sv WSBW from tracer budgets : 3-5 Sv AABW from shelf water budgets : 5-15 Sv AABW from PO4* and C-14 : 15 Sv Orsi, Johnson,Bullister, 1999, Prog.Oceanogr.43 55-109
AABW - Formation Rate from CFC Inventory CFC-inventory [million moles] Atlantic : 6.2 (1987) Ind.+Pac. : 4.8 (1993) Orsi, Johnson,Bullister, 1999, Prog.Oceanogr.43 55-109
Calculation of AABW formation by Orsi et al. all AABW formation regions treated similar: -- volume of water sinking across 2500m isobath: V -- entrainment of ambient water while sinking -- CFC- Saturation of this mix: 35% (from obs.) CFC Inventory = V• • 0.35 • C(t) dt + Loss Atlantic : 4.9 Sv 60% Indian + Pacific : 3.2 Sv 40% TOTAL: 8.1-9.4Sv Orsi, Johnson, Bullister, 1999
AABW Formation and CFCs in Ocean Climate Model Transient tracers to assess skill of NCAR model CFC- Inventory. ,AABW 106 moles obs. contr. --------------------------------------- Atlantic 1987 6.2 1.0 Ind+Pac 1993 4.8 0.6 Sensitivity studies: A) BBL: Beckmann and Döscher, 1997 B) High_sal: restore S to Smax on shelf and adjacent to it Doney and Hecht, JPO 32, 2002
Am Ad RS WS model with BBL WS: Weddell Sea RS: Ross Sea Ad: Adelie Coast Am: Amery Ice Shelf CFC Pt,BBL-Levitus CFC inventory: Atl. 1.0 (obs.6.2) I+P 0.7 (obs.4.8) S,BBL-Levitus sig2 BBL-Levitus 0° 90° 180° 270° 0° Doney and Hecht,2002
High_sal: restore S to Smax on shelf Am Ad RS WS improved AABW- formation CFC CFC-inventory: Atl. 3.4 (obs 6.2) I+P 1.4 (obs 4.8) pT,mod-Lev. S,mod-Lev Doney and Hecht,2002 0° 90° 180° 270° 0°
Detection of a new water mass in Drake Passage 1990 He-3 across Drake Passage He-anomaly at 2 = 36.95 Ant SAm 1999 Well, Roether, Stevens DSR ,subm.
SPDSW Southeast Pacific Deep Slope Water Well, Roether, Stevens,2002 Lupton, Pyle, Well, Jenkins, Schlosser, Top, 2002
With OMP analysis: Fraction SPDSW in % SPDSW Drake Passage: 7Sv (lADCP, CTD) ANT SA Well, Roether, Stevens
Formation rates of NADW using CFCs CFC-inventory LSW 1997: 16.6 million moles formation rate:4.4-5.6 Sv low NAO : 1.8- 2.4 Sv high NAO: 8.1-10.8 Sv Rhein, Fischer, Smethie, Smythe-Wright, Weiss, Mertens, Min, Fleischmann, Putzka, JPO, 2002
CFC - inventories and formation rates of NADW components 1991 1991-inventory formation rate million mole Sv uLSW 4.2 2.2 cLSW 14.7 7.4 ISOW 5.0 5.2 DSOW 5.9 2.4 ----------------------------------------------------- total 29.8 17.2 Sv Smethie and Fine, DSRI, 2001
CFC - inventories and formation rates of NADW components 1997 cLSW layer CFC-11 inventory 1997 inventory form.rate million mole Sv uLSW 7.4 2.6 cLSW 20.5 7.9 ISOW 10.0 7.7 DSOW 8.7 2.4 --------------------------------- total 46.6 20.6 LeBel, Smethie, Andrie, Bullister, Jones, Min, Rhein, Roether, Smythe-Wright, Weiss 2002
Modeling CFC inventories and LSW formation rates CFC observation 1/3° FLAME model formation rate by volume change : 4.3Sv rate from CFC inv: 3.5-4.4Sv a) CFC-11 model Böning, Rhein, Dengg, Dorow, GRL 2003, accepted b)
Ventilation of the Pacific from Tracer Ages CFC-11 along 135°W,1993 1400m 50°N 30°S Fine, Maillet, Sullivan, Wiley, JGR, 2001
CFC-inventory , 1993, full water column Bullister, Sonnerup, Fine, Min, Mecking, Smethie, Warner, Weiss, 2002
CFC ages on isopycnals SSM 26.2 STUW 25.0 B A NPIW SAMW 26.8 AAIW 27.2 C D Fine, Maillet, Sullivan, Wiley, JGR, 2001
NPIW SAMW Bullister et al., 2002
Ventilation flux [Sv] : Volume / mean tracer age Total Wind driven Thermohaline circ. < 26.5 26.5< <27.3 --------------------------------------------------------------- NP 111 Sv 50% 50% SP 123 Sv 35% 65% NP SP subtrop. gyre 41 Sv 25 Sv agree Sverdrup theory subpolar gyre 9 Sv 17 Sv Fine, Maillet, Sullivan, Wiley, JGR, 2001
Ventilation and Mixing of Indian Ocean Waters Full water column inventory in 1995: 100 million moles Fine, Smethie, Bullister, Min, Warner, Rhein, Weiss, DSR, revised, 2002 Poster
Age : time elapsed since last at the surface -- boundary conditions in source region -- Mixing : ages are not conservative
Thermocline ventilation in subtropical North Pacific dc/dt = -v•dc/dy +K•d²c/dy² model with CFCs ideal age tracer d /dt = -v•d/dy +K•d² /dy² +1 10°N NEC 20°N 40°N subp.gyre outcrop diffusion advection,diffusion diffusion Sonnerup,Quay, Bullister, DSR I, 1999
<15-25years : agree with CFC ages within 25% older : tracer ages considerably younger CFC-11 ages younger than CFC-12 difference increase with age CFC-11, 12 ages older than ratio ages Sonnerup, 2001, GRL 28, 1739-1742
Relationship between the ideal age and the tracer age Co(t) : conc. at surface G(r,t): age spectrum C(r,t)=Co(t-t‘) G(r,t‘)dt‘ Holzer and Hall, 2000 G(r,t) dt: mass fraction of fluid at r that was at the surface at time interval t -- t+dt 1st temporal moment: mean age 2nd temp. moment: width of the age spectrum Waugh, Hall, Haine, JGR, 2002, subm.
Testing in a GCM mean age tracer age ideal age a) 300m b) 1000m c) 1500m Khatiwala, Visbeck, Schlosser, DSR I, 2001
after 200 years integration: mean ³H-³He ideal Labrador Sea (1500m) 3.3 3.9 4.0 Subtrop. subduction (500m) 15.8 12.8 21.7 Western Boundary (1500m) 38.4 35.8 56.7 -- tracer ages younger than ideal ages -- mean age sensitive to long transit time pathways although they make up only a small fraction Khatiwala, Visbeck, Schlosser, 2001
use temporal change of ³H/³He ages to estimate mixing a) b) Robbins,Price,Owens, Jenkins, JPO 30, 2000 c) Isopycnals outcrop north Azores Current: southward penetration by lateral mixing across AC at 33°N
Relic CFC-11 age, Labrador Sea Water LSW estimates time scales of spreading for young component age in source region: 15 years Fine, Rhein, Andrie, GRL,2002, subm.
Future developments moored tracer sampler
Conclusions -- CFC inventories: AABW and NADW formation rates -- ³He signal: new water mass in Drake Passage -- CFC ages : Ventilation rates of upper and intermediate Pacific -- ³H/³He age : role of lateral mixing -- tracers to assess model skills -- tracer age - ideal age , age spectrum
WOCE Tracer: all sections (concentrations) isopycnal age distributions, North and South Atlantic: CFCs, ³H, ³He www.ocean.uni-bremen.de/en/projects/aims/tab.html .... /projects/aims/isoage.html .... /projects/aims_satl/qual.html