Download
1 / 35
350 likes | 419 Vues
Linkage in Selected Samples. Boulder Methodology Workshop 2005 Michael C. Neale Virginia Institute for Psychiatric & Behavioral Genetics. Basic Genetic Model. Pihat = p(IBD=2) + .5 p(IBD=1). 1. 1. 1. 1. 1. 1. 1. Pihat. E1. F1. Q1. Q2. F2. E2. e. f. q. q. f. e. P1. P2.

E N D
Linkage in Selected Samples Boulder Methodology Workshop 2005 Michael C. Neale Virginia Institute for Psychiatric & Behavioral Genetics
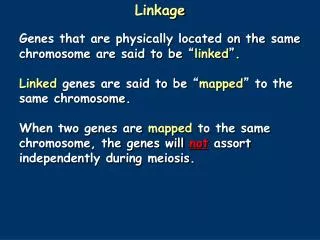
Basic Genetic Model Pihat = p(IBD=2) + .5 p(IBD=1) 1 1 1 1 1 1 1 Pihat E1 F1 Q1 Q2 F2 E2 e f q q f e P1 P2 Q: QTL Additive Genetic F: Family Environment E: Random Environment3 estimated parameters: q, f and e Every sibship may have different model P P
Mixture distribution model Each sib pair i has different set of WEIGHTS rQ=.0 rQ=1 rQ=.5 weightj x Likelihood under model j p(IBD=2) x P(LDL1 & LDL2 | rQ = 1 ) p(IBD=1) x P(LDL1 & LDL2 | rQ = .5 ) p(IBD=0) x P(LDL1 & LDL2 | rQ = 0 ) Total likelihood is sum of weighted likelihoods
QTL's are factors • Multiple QTL models possible, at different places on genome • A big QTL will introduce non-normality • Introduce mixture of means as well as covariances (27ish component mixture) • Mixture distribution gets nasty for large sibships
Biometrical Genetic Model Genotype means 0 AA m + a -a +a d Aa m + d aa m – a Courtesy Pak Sham, Boulder 2003
Mixture of Normal Distributions :aa :Aa :AA Equal variances, Different means and different proportions according to allele frequencies
Implementing the Model • Estimate QTL allele frequency p • Estimate distance between homozygotes 2a • Compute QTL additive genetic variance as • 2pq[a+d(q-p)]2 • Compute likelihood conditional on • IBD status • QTL allele configuration of sib pair (IBS)
27 Component Mixture Sib1 AA Aa aa Sib 2 AA Aa aa
19 Possible Component Mixture Sib1 AA Aa aa Sib 2 AA Aa aa
Results of QTL Simulation 3 Component vs 19 Component 3 Component 19 Component Parameter True Q 0.4 0.414 0.395 A 0.08 0.02 0.02 E 0.6 0.56 0.58 Test Q=0 (Chisq) --- 13.98 15.88 200 simulations of 600 sib pairs each GASP http://www.nhgri.nih.gov/DIR/IDRB/GASP/
Information in selected samples Concordant or discordant sib pairs • Deviation of pihat from .5 • Concordant high pairs > .5 • Concordant low pairs > .5 • Discordant pairs < .5 • How come?
Pihat deviates > .5 in ASP Larger proportion of IBD=2 pairs t IBD=2 Sib 2 IBD=1 IBD=0 t Sib 1
Pihat deviates <.5 in DSP’s Larger proportion of IBD=0 pairs t IBD=2 Sib 2 IBD=1 IBD=0 t Sib 1
Sibship NCP Sibship NCP 2 2 1.5 1.5 1 1 0.5 0.5 0 4 0 Sibship NCP 3 2 4 1 2 3 -4 0 -3 2 Sib 2 trait -1 -2 1.5 1 -1 -2 0 -4 0 1 1 -3 -3 2 Sib 1 trait Sib 2 trait -2 -1 3 -4 -1 0.5 4 -2 0 1 -3 2 0 Sib 1 trait 3 -4 4 4 3 2 1 -4 0 -3 Sib 2 trait -1 -2 -1 -2 0 1 -3 2 Sib 1 trait 3 -4 4 Sibship informativeness : sib pairs dominance rare recessive unequal allele frequencies Courtesy Shaun Purcell, Boulder Workshop 03/03
Two sources of information Forrest & Feingold 2000 • Phenotypic similarity • IBD 2 > IBD 1 > IBD 0 • Even present in selected samples • Deviation of pihat from .5 • Concordant high pairs > .5 • Concordant low pairs > .5 • Discordant pairs < .5 • These sources are independent
Implementing F&F • Simplest form test mean pihat = .5 • Predict amount of pihat deviation • Expected pihat for region of sib pair scores • Expected pihat for observed scores • Use multiple groups in Mx
Predicting Expected Pihat deviation t IBD=2 Sib 2 + IBD=1 IBD=0 t Sib 1
Expected Pihats: Theory • IBD probability conditional on phenotypic scores x1,x2 • E(pihat) = p(IBD=2|(x1,x2))+.5p(IBD=1|(x1,x2)) • p(IBD=2|(x1,x2)) = NIBD=2(x1,x2) / • [NIBD=2(x1,x2) + 2NIBD=1(x1,x2) + NIBD=0(x1,x2)] p(IBD=2 |(x1,x2))+p(IBD=1 |(x1,x2))+p(IBD=0 |(x1,x2))
Expected Pihats • Compute Expected Pihats with pdfnor • \pdfnor(X_M_C) • Observed scores X (row vector 1 x nvar) • Means M (row vector) • Covariance matrix C (nvar x nvar)
How to measure covariance? t IBD=2 + IBD=1 IBD=0 t
Ascertainment • Critical to many QTL analyses • Deliberate • Study design • Accidental • Volunteer bias • Subjects dying
Exploiting likelihood • Correction not always necessary • ML MCAR/MAR • Simulate bivariate normal data X,Y • Sigma = 1 .5 • .5 1 • Mu = 0, 0 • Make some variables missing • Generate independent random normal variable, Z, if Z>0 then Y missing • If X>0 then Y missing • If Y>0 then Y missing • Estimate elements of Sigma & Mu • Constrain elements to population values 1,.5, 0 etc • Compare fit • Ideally, repeat multiple times and see if expected 'null' distribution emerges
Resultsof simulation Population covariance 1 .5 1 Means 0, 0
Weighted likelihood approach • Usual nice properties of ML remain • Flexible • Simple principle • Consideration of possible outcomes • Re-normalization • May be difficult to compute
Example: Two Coin Toss 3 outcomes Frequency 2.5 2 1.5 1 0.5 0 HH HT/TH TT Outcome Probability i = freq i / sum (freqs)
Example: Two Coin Toss 3 outcomes Frequency 2.5 2 1.5 1 0.5 0 HH HT/TH TT Outcome Probability i = freq i / sum (freqs)
Non-random ascertainment Example • Probability of observing TT globally • 1 outcome from 4 = 1/4 • Probability of observing TT if HH is not ascertained • 1 outcome from 3 = 1/3 • or 1/4 divided by ‘Ascertainment Correction' of 3/4 = 1/3
Correcting for ascertainment Univariate case; only subjects > t ascertained N t 0.5 0.4 0.3 G 0.2 likelihood 0.1 0 -4 -3 -2 -1 0 1 2 3 4 : xi
AscertainmentCorrection • Be / All you can be N(x) Itx N(x) dx
Affected Sib Pairs 4 4 Itx ItyN(x,y) dy dx + + + 1 0 + + + + + ty + + + + + + + + + + + + + + + + + + + + + + + + + tx 0 1
4 4 Itx ItyN(x,y) dy dx Ascertainment Corrections for Sib Pairs ASP ++ 4 ItxItyN(x,y) dy dx DSP +- -4 ItxItyN(x,y) dy dx CUSP +- -4 -4
Correcting for ascertainment Linkage studies • Multivariate selection: multiple integrals • double integral for ASP • four double integrals for EDAC • Use (or extend) weight formula • Precompute in a calculation group • unless they vary by subject
Null Model 50% heritability No QTL Used to generate null distribution .05 empirical significance level at approximately 91 Chi-square QTL Simulations 37.5% heritability 12.5% QTL Mx: 879 significant at nominal .05 p-value Merlin: 556 significant at nominal .05 p-value Some apparent increase in power Initial Results of Simulations
1.00 F lm l1 l2 l3 S1 S2 S3 Sm e1 e2 e3 e4 Measurement is KEY Need continuous interval scales Most complex traits not measured this way Use latent trait instead Factor model equivalent to Item response theory model Can allow for non-normal Factors Measurement of multiple Sx
Quantifying QTL variation in selected samples can be done Can be computationally challenging May provide more power Permits multivariate analysis of correlated traits Conclusion