Download
1 / 28
280 likes | 479 Vues
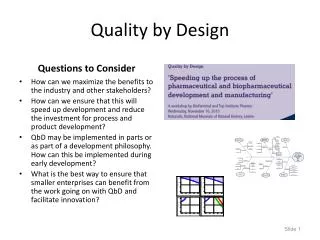
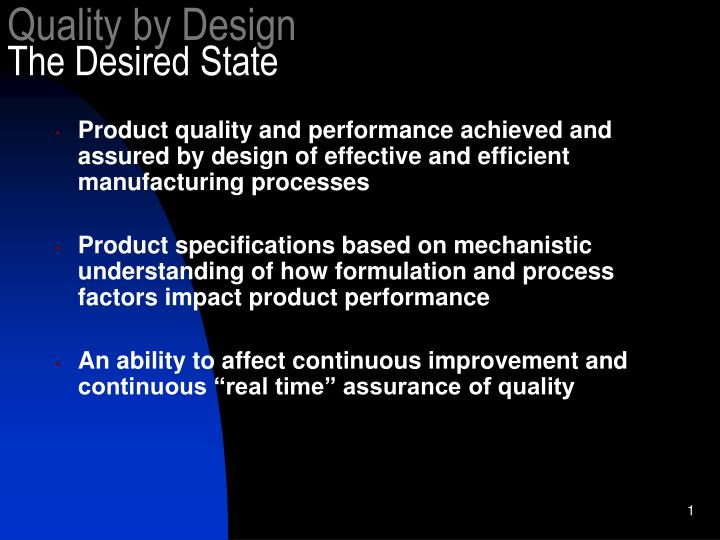
Quality by Design The Desired State. Product quality and performance achieved and assured by design of effective and efficient manufacturing processes Product specifications based on mechanistic understanding of how formulation and process factors impact product performance

E N D
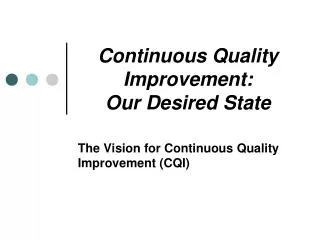
Quality by DesignThe Desired State • Product quality and performance achieved and assured by design of effective and efficient manufacturing processes • Product specifications based on mechanistic understanding of how formulation and process factors impact product performance • An ability to affect continuous improvement and continuous “real time” assurance of quality
Quality by DesignMitigating Risk in Pharmaceutical Development A process is well understood when: • All critical sources of variability are identified and explained • Variability is managed by the process, and, • Product quality attributes can be accurately and reliably PREDICTED over the DESIGN SPACE established for materials used, process parameters, manufacturing, environmental and other conditions. Guidance for Industry: PAT – A Framework for Innovative Pharmaceutical Development, Manufacturing and Quality Assurance, page 6
1st Principles MECHANISTIC MODELS EMPIRICAL MODELS HEURISTIC RULES (HISTORICAL) DATA DERIVED FROM TRIAL-N-ERROR EXPERIMENTATION Quality by Design? Product Development Knowledge (Public Databases or in Submissions) Level of Sophistication HIGH MEDIUM LOW Details Resolved HIGH MEDIUM LOW Dr. Ajaz Hussein
Quality by Design Performance of a Solids Processing Units Performance of a Unit Bulk Mechanical Properties Angle of repose Unconfined yield stress Forces Acting on Particles Adhesion forces Impact forces Material Characteristics Hamaker constant Dielectric constant Young’s modulus Particle Attributes PSD Shape Composition Equipment Design Geometry Constituent parts Material properties Operating Conditions Speed of moving parts Temperature Humidity AIChE Journal 47: 107-125 (2001) Dr. Ajaz Hussein
Control VARIABILITY Reduce UNCERTAINTY Uncertainty – the inability to determine or the ambiguity in the true state of a system caused by a combination of variability and incomplete knowledge (ICH Q9) • Mitigate risk • Knowledge transfer to manufacturing and regulatory bodies Quality by DesignThe Way Forward • Identify and control all sources of • variability • Raw materials • Process • Environmental • Manage variability through the • process
MANUFACTURING EXCELLENCE QbD Continuous Improvement
Where To Start • Dosage Form Considerations Extended Release vs. Immediate? • Clinical Considerations Established IVIVc • Drug Product Attributes Low Dose? • Drug Substance Attributes Stable Polymorph, hydroscopic?
Basic Concept of BCS Drug Product Absorbed drug Dissolved Drug kp kd • kd = dissolution rate • function of drug solubility and drug product quality attributes • kp = permeability rate • major function of API structure • minor dependence on salt form and excipients.
DEFINITIONS • Critical Quality Attributes Purity Potency Bioavailability • Critical Process Parameters - Critical To Quality Attributes (API, DP properties that can affect CQA’s) - Key Process Variables
Drug Release Rate Quality Attributes Of Drug Product Disintegration, Erosion and Granule Dissolution Swelling/ Water Penetration API Solubilization (rate/extent) Hardness Porosity Wetting API Form Selection (Salt, Polymorph, Particle Size) DP Excipient Selection, DP Process Selection API Form Selection, API Process Selection Features of “Quality by Design”: doing things consciously* *A Quality by Design Approach to Dissolution Based on the Biopharmaceutical Classification System, R. Reed
RISK MANAGEMENT Risk Benefit
Quality Risk Assessment (QRA) • FMEA: Risk scores based on probability, severity, and detectability • Risk Prioritization Matrix • Quality Function Deployment • Fish bone or Ishikawa diagram • Pareto Chart
ELEMENTS OF A SUCCESSFUL QbD PROGRAM Robust Product Process Formulation & Materials Equipment
Compression Blending Raw Material Tooling Cam selection Surface Discharge rate Fill Weight Feed frame setting Mg. Stea TALC Material addition Feeder speed Fill Vol. Order ofddn. HPMC API Press speed Pre & Post Compression Blend time Blend rpm Hardness of Tablet (Friability) Storage Discharge Roll force Roll Gap Transport Moisture PSD Porosity (den) Humidity Temp. Ribbon strength Material Transfer Environmental Roller Compaction Tablet Hardness Basic risk facilitation methods • Cause Effect Diagram for Tablet Hardness
DEFINITIONS Design Space Clinical Relevance Control Space Process Capability Control Strategy Change Control Continuous Improvement Regulatory Considerations
Bin Blend Robust Manufacturing ProcessesProcess and Control Parameters Process Parameter Attributes Viscosity, Methoxyl, hydroxypropyl content, Particle size Raw Material Attributes Hypromellose Blend Uniformity Blending time/end point Roll force Roll gap Roll speed Feed screw rate Milling conditions • Ribbon Attributes • Porosity Roller Compaction • Granule Attributes • psd Bin Blend Blend time/end point Blend Uniformity • Tablet Attributes • hardness Compression force Press speed Feeder speed Compression Appearance, Tablet weight gain Pan Speed EEF Film Coating Clinical relevance
Table 3.1-6: Roller Compaction Unit Operation Critical / Non-Critical Parameter Control Space Design Space Key Attributes Roller Compaction -Roll Gap -Roll Force Critical Critical Table 3.1-7 for 100 mg and Table 3.1-8 for 200 mg Table 3.1-7 for 100 mg and Table 3.1-8 for 200 mg Particle Size Distribution (in‑line) Tablet Hardness Dissolution -Feed Screw Speed Non-Critical Not Applicable Not Applicable a Roll Speed Non-Critical 7-9 6-10 Milling -Pre-granulator -Fine Screen granulator Non-Critical Non-Critical Adjust rpm to maintain throughput Adjust rpm to maintain throughput • a. Controlled by Roll Gap Critical & Non Critical ParametersControl Space/Design Space (Example)
Roll gap Roll gap Polymer Roll force Roll force Quality by Design -Tablet DevelopmentScale-up Parameters for Roller Compaction Pilot-scale (design space) Manufacturing scale (predicted design space) 2.2 mm 3.8 mm Scale up 52.11% 52.11% Polymer 1.8 mm 3.0 mm 40% 40% 55 bar 65 bar 45 bar 65 bar Polymer conc. 40-52.1% Roll Gap 1.8 –2.2 mm Roll force 45-65 bar Polymer conc. 40-52.1% Roll Gap 3.0-3.8 mm Roll force 55-65 bar
4.0 mm 3.8 mm Roll gap 3.8 mm 3.6 mm Polymer 70 bar 3.4 mm 52.1% Roll force 3.2 mm 3.0 mm 40.0% 2.8 mm Failed batch 55 bar 65 bar Good batch Quality by Design - Tablet DevelopmentConfirmation of Design Space at Mfrg Scale • Batches Manufactured Outside the of the Roll Compaction Design Space Fail Tablet Compression
Control/Design Space – Critical Process Parameters • Critical Process Parameters (CPP) identified using a risk analysis investigated extensively using a DOE. • Design Space • Established on the basis of the DOE and experience during manufacture of clinical/registration batches • In certain cases where response of critical quality attribute studied/investigated was insignificant, extrapolation was used to expand/establish design space • Control Space • Subset of design space established on the basis of process capability, prior knowledge • Intent is to stay within the control space during commercial manufacturing
Control/Design Space – Non-Critical Process Parameters • Non-Critical Process Parameters – those identified as low risk which lead to low probability of product failure • Design Space • Established on the basis of range studies (in some cases DOE’s) and manufacturing experience at various scales • Control Space • Subset of design space established on the basis of process capability, prior knowledge • Intent is to stay within the control space during commercial manufacturing
Design Space and Control Space Design Space Multi-dimensional space that encompasses combinations of product design, manufacturing process design, critical manufacturing process parameters and component attributes that provide assurance of suitable product quality and performance Control Space Multi-dimensional space that encompasses process operating parameters and component quality measurements that assure process or product quality. It is a subset of the design space Control Strategy Strategy/Methodology to mitigate risks associated with the batch when the critical and non-critical process parameters fall outside the control space butwithin the design space
Control strategy - Critical Process Parameters • HPMC • Single point dissolution within control space • Dissolution profile when HPMC outside control space but within design space is used • Roll Gap and Roll Force • Single point dissolution within control space • Dissolution profile when roll gap and roll force are outside control space but within design space is used • Impact of product being manufactured outside control space and within design space will be assessed through the Event Report Forms • If control space is revised based on experience during manufacturing, will manage the change through the plant change control system and notify the agency via the annual report
Are all CPPs within their control spaces? Are all CPPs within their design spaces? Full Investigation according to plant systems NO NO Event Report Forms will be generated when CPP’s are outside control space but within the design space YES YES Log sample for full (multi-point dissolution) testing in LIMS Log sample for regular (single point) dissolution testing in LIMS Track and Trend Events to monitor type and number of occurrences Evaluate data for disposition React and study when number of occurrences indicate out of trends Note: Decision for testing is based on data entry captured in MBR where the control and design space values will be identified Decision Tree for Batch Disposition Based on Control/Design Space – CPP’s
Are all non-CPPs within their control spaces? Generate an Event Report Form NO Track and Trend Events to monitor type and number of occurrences YES Impact of Event and action assessed by QA No action, proceed as usual Batch disposition React and study when number of occurrences indicate out of trends Decision Tree for Batch Disposition Based on Control/Design Space – Non-CPP’s
Closing Statement • Lead or Bleed! • Just Do It! • The future ain’t what it use to be!