Download
1 / 6
60 likes | 239 Vues
Evaluating Light Rain Drop Size Estimates from Multi -Wavelength Micropulse Lidar Network Profiling S. Lolli Code 612/JCET, E. Welton Code 612, NASA GSFC , J. Campbell, NRL. May 9, 2012 MPLNET Data: GSFC, Maryland.

E N D
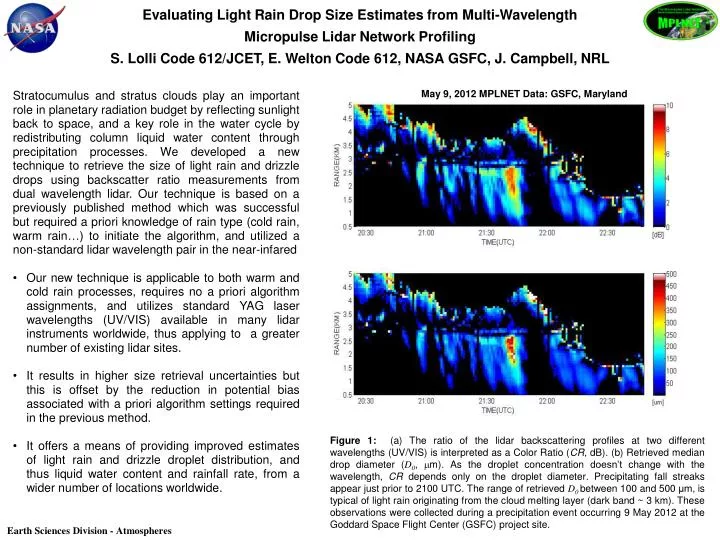
Evaluating Light Rain Drop Size Estimates from Multi-Wavelength MicropulseLidar Network ProfilingS. Lolli Code 612/JCET, E. Welton Code 612, NASA GSFC, J. Campbell, NRL May 9, 2012 MPLNET Data: GSFC, Maryland • Stratocumulus and stratus clouds play an important role in planetary radiation budget by reflecting sunlight back to space, and a key role in the water cycle by redistributing column liquid water content through precipitation processes. We developed a new technique to retrieve the size of light rain and drizzle drops using backscatter ratio measurements from dual wavelength lidar. Our technique is based on a previously published method which was successful but required a priori knowledge of rain type (cold rain, warm rain…) to initiate the algorithm, and utilized a non-standard lidar wavelength pair in the near-infared • Our new technique is applicable to both warm and cold rain processes, requires no a priori algorithm assignments, and utilizes standard YAG laser wavelengths (UV/VIS) available in many lidar instruments worldwide, thus applying to a greater number of existing lidar sites. • It results in higher size retrieval uncertainties but this is offset by the reduction in potential bias associated with a priori algorithm settings required in the previous method. • It offers a means of providing improved estimates of light rain and drizzle droplet distribution, and thus liquid water content and rainfall rate, from a wider number of locations worldwide. Figure 1:(a) The ratio of the lidar backscattering profiles at two different wavelengths (UV/VIS) is interpreted as a Color Ratio (CR, dB). (b) Retrieved median drop diameter (D0, mm). As the droplet concentration doesn’t change with the wavelength, CR depends only on the droplet diameter. Precipitating fall streaks appear just prior to 2100 UTC. The range of retrieved D0 between 100 and 500μm, is typical of light rain originating from the cloud melting layer (dark band ~ 3 km). These observations were collected during a precipitation event occurring 9 May 2012 at the Goddard Space Flight Center (GSFC) project site. Earth Sciences Division - Atmospheres
Name: Simone Lolli, NASA GSFC, Code 612 and UMBC/JCETE-mail: simone.lolli@nasa.govPhone: 301-614-6340 References: Lolli, S., E.J. Welton, and J.R. Campbell (2013). Evaluating light rain drop size estimates from multi-wavelength Micro Pulse Lidar Network profiling, Accepted on 10 September 2013, Journal of Atmospheric and Oceanic Technology (JTECH), doi: http://dx.doi.org/10.1175/JTECH-D-13-00062.1 Data Sources: NASAMPLNET; we credit the excellent work performed by the MPLNET staff. Technical Description of Figures: The size of cloud and rain drops associated with boundary layer clouds determine their impact on the radiation budget and water cycle. Raindrop size controls the rate at which liquid water is deposited through the atmosphere and how quickly it is evaporated below cloud base. Doppler radar retrievals of raindrop size distribution are limited to events with rainfall rates in excess of ~6 mm/hr, thus excluding many light rain and drizzle events. Our technique is especially useful for dual wavelength lidar sites located near multi-frequency Doppler radar stations. Figure 1: The atmospheric profiles of the backscattering coefficients are retrieved form backscattered range corrected lidar signal during precipitation at 527 nm and 355 nm, respectively. It is possible then to define a color ratio CR, as ten times the common logarithm of the ratio of the two backscattering coefficients at each range gate. Figure 1 (upper plot) is showing the temporal evolution of the measured CR on 09 May 2012 from 2024 UTC to 2248 UTC. It is clearly visible that in the precipitation, starting at around 2100 UTC, there is differential backscattering at the two wavelengths. From Mie scattering theory applied to spherical water particles, it is possible to calculate the backscattering cross-section, size-diameter dependent, at both wavelengths. As the number density does not change with wavelength, it is possible to calculate the theoretical CR, dependent on raindrop diameter, assuming a gamma raindrop size distribution. Evaluating aerosol contribution and relative transmission losses through a lookup-table, it is then possible to retrieve the raindrop diameter during the precipitation. In Figure 1 (lower plot), the raindrop diameter range within precipitating fall streaks is between 100 and 500μm, consistent with a light rain process originating from the melting layer. This is visible (lidar dark band) as a horizontal pattern in both signal composites of Figure 1 at around 3 km above sea level. Scientific significance:In the context of cloud-resolving models, raindrop size crucially affects the dynamics of the simulated systems, and in particular the time scale of latent heating release. The latter is an essential component of the cumulus parameterizations used in large-scale circulation models. Previous multi-frequency ground-based Doppler radar techniques have attempted to measure rain and drizzle droplets size. However, an ambiguity arises because the measured mean Doppler velocity has a significant contribution from the vertical velocity of the air, and rain rate and drop size retrieval are unambiguous only if the rain rate is known a priori to be greater than 6 mm/hr. This means that Doppler radars (even using three frequencies) cannot provide a sufficient accurate drop size measurement for light rain and drizzle. Our technique offers a means of providing improved estimates of light rain and drizzle droplet distribution using dual wavelength lidars. Dual wavelength lidar sites located near multi-frequency Doppler radar stations would provide more complete retrievals across the droplet size distribution spectrum. Relevance to future science and NASA missions: The NASA Micro Pulse Lidar Network (MPLNET) is enhancing the project with the possibility of integrating UV lidar instruments in the network. When possible, co-located UV and VIS lidar profiling would further provide a value-added product reporting these parameters for light rain and drizzle events, with the goal of an improved understanding of the microphysics and physical scattering properties of the precipitation from global ground-based measurements. However, this technique is applicable to many existing lidar sites around the world, not just MPLNET. Earth Sciences Division - Atmospheres
Rain Characteristics and Large-Scale Environments of Extreme Wet Precipitation Systems from TRMM Measurements Yaping Zhou, William K. M. Lau, Chuntao Liu(Code 613, NASA GSFC) • One of the most fascinating characteristics of rainfall is the large scale range: the smallest precipitation features (PF) occupy less than a single satellite footprint or a few kilometers, while the largest ones span thousands of kilometers in space. Grouping contiguous satellite rainy footprints as independent PFs and then sorting out millions of them according to their total rain volume allow us to study rain characteristics with different total rainfall during the 14-year TRMM period over the global tropics and subtropics. We find: • Similar as the world’s wealth distribution, rainfall distribution is also highly skewed with the top 1% of the rainiest PFs contributing over 55% and the bottom 90% contributing less than 20% of the total rainfall. The top 10% is found to be a critical threshold beyond which the PFs grow exponentially into larger, deeper and colder systems. • Rain volume tends to increase in areas of enhanced moisture content and upward velocity, especially at 10%, where a rapid increase in vertical velocity provides large moisture convergence required in extreme precipitation events. The increasing moisture content in the atmosphere is regarded as the major mechanism for the increase of extreme rainfall events in a warmer climate. • The study illustrates distinct stages in the development of an extreme rainfall, including 1) a systematic build-up in large-scale temperature and moisture, 2) a rapid change in rain structure, 3) explosive growth of the PF size, and 4) a release of convective available potential energy before the demise of the event. Figure 1 (left):Percentile thresholds in total rain volume (black) and cumulative rain amount in percentage (red). Figure 1 (right):Geographical distributions of PFs with extreme total rain volume. Contours show the total number of extreme PFs in top 1% in 2ox2o grid boxes. Green, purple and black triangles mark rain events in top 0.1%, 0.01% and 0.001%, respectively. Figure 2: Systematic changes (mean and one standard deviation error bars) of (a) minimum infrared radiation (MinIR), (b) total precipitable water (PWV) and (c) vertical velocity (omega) at 500 hPawith rain percentiles in tropical and subtropical oceans. Earth Sciences Division - Atmospheres
Name: Yaping Zhou, NASA/GSFC, Code 613; GESTAR/Morgan State University E-mail: Yaping.Zhou-1@nasa.gov Phone: 301-614-6235 References: Zhou, Y., W. K. M. Lau, and C. Liu (2013), Rain characteristics and large-scale environments of precipitation objects with extreme rain volumes from TRMM observations, Journal of Geophysical Research - Atmosphere, 118, 9673–9689, doi:10.1002/jgrd.50776. Data Sources: TRMM Precipitation Feature (PF) database including retrievals from TRMM PR, TMI, VIRS, LIS; NCEP Reanalysis; TRMM 3B42 daily precipitation products. Technical Description of Figures: Figure 1: (Left) Thresholds and cumulative percentage of rain amount with percentiles in rain volume. The thresholds increase nonlinearly as the percentile tends toward extreme categories, with an abrupt jump near the top 10thpercentile. The cumulative PDF shows that PFs from the top 1% contribute to over 55% of the total instantaneous rainfall, while those below the 10th percentile (or the lower 90%) contribute less than 20% of the total rainfall. (Right) Geographical distribution of PFs with extreme rain volume in the top 0.1%, 0.01% and 0.001%. It shows that most of the extreme wet PFs occur over the oceans as opposed to over the land regions in the case of severe storms. Figure 2: Systematic changes (mean values and one standard deviation error bars) of rain characteristics and large-scale environment parameters with different percentile of total rain volume. Mean characteristics of PFs shows that PFs get substantially larger, colderand deeper as the total rain volume reaches top 10-1%. Only MinIR that indicates cloud top height is shown in this figure. The NCEP reanalysis shows that rain volume tends to increase in areas of enhanced total precipitable water. A rapid increase of upward vertical velocities at 10% can be seen to provide necessary dynamic support of extreme precipitation events. Scientific significance: By grouping and compositing millions of satellite measured instantaneous precipitation features based on their total rain volume in the global tropics, we have showed not only the statistical distribution, rain structure and regional differences of PFs with extreme volumes of precipitation in tropical and subtropical land and oceans, but also illustrated their development stages and associated large-scale environments. The study illustrates important roles of large-scale moisture and dynamic conditions for occurrences of extreme precipitation. It has been widely accepted that increasing moisture in the atmosphere is a major mechanism for increasing extreme precipitation in a warming climate. This study shows a consistent increase of total rainfall volume with the increase of total precipitable water in the real worldthat confirms this connection. It further imply that more extreme precipitation events are likely to occur in a warmer climate when atmosphere moisture content is higher. Relevance to future science and NASA missions:This research is directly relevant to NASA’s Global Precipitation Measurement (GPM) mission which aims to utilize satellite-based precipitation information for studies of climate and weather. It addresses global and regional variability of high-impact extreme precipitation events and the structure and development of extreme precipitation. It shows statistical connections between individual extreme events and high precipitable water vapor in the large-scale environment that could provide important implications for the future climate. Earth Sciences Division - Atmospheres
Unusually Low Chlorine in the 2011 Antarctic VortexS.E. Strahan, A.R. Douglass, and S.D. Steenrod, Code 614, NASA GSFC Aura Microwave Limb Sounder (MLS) measurements show that the Antarctic ozone (O3) hole in 2011 appears similar to the 2006 O3 hole, the largest hole ever observed. But ClO, a reactive chlorine gas responsible for ozone depletion, was unexpectedly 20% lower in the O3 hole in 2011 than in 2006. Temperatures were low in both years and the small decrease expected in chlorofluorocarbons between 2006 and 2011 is too small to explain this. N2O is a long-lived tracer of stratospheric transport. MLS N2O measurements in March 2011 showed unusual transport of tropical air to the Antarctic middle stratosphere. The tropical air, trapped inside the vortex as it formed, had less inorganic chlorine (Cly) than air that typically fills the vortex. The low Cly air cooled and descended, arriving in the lower stratosphere by late winter. Low chlorine resulted in less ClO and less ozone loss than usual. We used the GMI chemistry and transport model with MERRA meteorology to calculate how transport and chemistry contributed to the large 2011 O3 hole. Our calculations showed there was much less O3 loss than in 2006, and that weak transport resulted in a lower O3 column. Together, less chemical loss and less ozone transport made the 2011 O3 hole appear deep. Figure 2:MLS 2011 Antarctic N2O anomaly (relative to a 9-year mean of MLS data). The high anomaly (brown) is trapped in the vortex in March, descending to the lower stratosphere by August. High N2O is correlated with low Cly. Figure 1: MLS Stratospheric Column O3 in 2006 and 2011. The ozone minimum and hole area are similar in both years. Figure 3: GMI calculations showing the contributions to October column O3 due to transport (top panels) and chemical O3 loss (bottom panels) in 2006 and 2011. The chemical loss is the difference between two simulations, one with full chemistry and the other with all heterogeneous chemical reactions turned off. This simulates the effect of O3 loss due to chlorine and bromine on polar stratospheric clouds. Ozone loss was much lower in 2011. The vortex is outlined in white. In 2011, the areas of low O3 transport and low chemical loss are outlined in yellow. Earth Sciences Division - Atmospheres
Name: Dr. Susan Strahan, NASA/GSFC, Code 614, and Goddard Earth Science Technology and Research (GESTAR) E-mail: susan.e.strahan@nasa.gov Phone: 301-614-5995 References: Strahan, S.E., A.R. Douglass, and S.D. Steenrod (2013), Unusually low chlorine in the 2011 Antarctic vortex, Geophysical Research Letters, submitted. Strahan, S.E., A.R. Douglass, and P.A. Newman (2013), The contributions of chemistry and transport to low Arctic ozone in March 2011 derived from Aura MLS Observations, Journal of Geophysical Research Atmospheres, 118, doi:10.1002/jgrd.50181. Data Sources: Data analyzed included Aura Microwave Limb Sounder (MLS) v3.3 O3, N2O, ClO, HCl, and temperature. Global Modeling and Assimilation Office (GMAO) MERRA meteorological fields were used to integrate simulations of the NASA Global Modeling Initiative (GMI) chemistry and transport model. Technical Description of Figures: Figure 1: MLS stratospheric column O3 (DU) with overlays of the 200 DU contour (dashed) and the vortex edge on the 500K isentropic surface (white) for October 5, 2006 and 2011. The 200 DU contour is equivalent to the 220 DU total column contour which is typically used to define the ozone hole. The ozone hole area occupies most of the vortex. Figure 2. Time series of the MLS daily zonal mean percentage anomaly averaged over 76-82oS, calculated with respect to the MLS 2005-2013 daily means. Figure 3. Top: Stratospheric column O3 (DU) for the GMI ‘No Het’ simulations without heterogeneous chemistry (i.e., PSCs) , Oct. 5, 2006 (left) and Oct. 5, 2011 (right), same dates as MLS data shown in Figure 1. Bottom: Heterogeneous chemical loss calculated by differencing the GMI ‘No Het’ and GMI full chemistry simulations on the same dates. The 500K vortex edge (white) and MLS 200 DU (red) contours are overlaid. The region of very low O3 in the 2011 ‘No Het’ run is outlined in yellow and is overlaid on the 2011 Het Loss panel. This shows that the region with weak O3 transport corresponds to the region with little O3 loss. This is the region most affected by the anomalous tropical transport into the Antarctic that occurred more than 6 months earlier. Scientific significance: Previous research implied that the Montreal Protocol has led to the start of recovery of the ozone hole, but these results show that is not yet the case – the ozone hole depth varies for reasons beyond the removal of ozone-depleting gases emitted by humans. The new understanding of ozone hole dynamics suggests that the role of transport in the delivery of ozone to the Antarctic in winter and spring must be accounted for in the attribution of ozone hole recovery to declining ozone-depleting substances. Relevance to future science and NASA missions: Ozone monitoring alone cannot show the role of transport. This study demonstrates the critical importance in continued satellite measurement of long-lived stratospheric trace gases such as N2O to identify and attribute ozone recovery. Earth Sciences Division - Atmospheres