Download
1 / 40
400 likes | 485 Vues
(continued). Accretion Processes in Star Formation Lee Hartmann Cambridge Astrophysics Series, 32 Cambridge University Press (also from Nuria Calvet talks (2004). Energetic Problem in TTS. CTTS, L bol > L * ( > 10% on average). An additional source of energy is required.

E N D
(continued) Accretion Processes in Star Formation Lee Hartmann Cambridge Astrophysics Series, 32 Cambridge University Press (also from Nuria Calvet talks (2004)
Energetic Problem in TTS • CTTS, Lbol > L* ( > 10% on average). • An additional source of energy is required. • This source must also be responsible for the other peculiarities: • Broad emission lines • “Veiling” • NIR excess • Forbidden emission lines LJ , good measure of L*, because the stellar luminosity peaks in J band from Hartmann 1998
The origin of the energy excess • FUV spectra ~ solar cromosphere and active stars (stronger lines, however) • In’70s, amplified cromosphere? • NO, a more extended region is required to account for the observed Ha flux Calvet et al 2004
Observed Ha line profiles of CTTS Peak ~ v0 Broad wings Absorption blueshifted component. Edwards et al 1994
Line formation: P Cygni profile Line is formed in an expanding shell as,eg, in a wind~spheric structure BUT the CTTS profiles are NOT single P Cygni profiles, but much more complex!
Redshifted absorption in CTTS line profiles Infall signature – Inverse P Cygni profile Edwards et al 1994
“infall” and “outflow” signatures in the same line profile Hartmann 1982
“infall”and “outflow” • Accretion energy is the most likely source for the extra emission of CTTS, and it is naturally expected to be released in the process of star formation. • TTS emission line profiles cannot be interpreted in the frame of a spheric wind or collapse. • Observations indicate that the “cores” are slowly rotating: Core-collapse under conservation of energy (E) and angular momentum (J) results in the formation of a disk (“accretion disk”). • Accretion disks play important role • Disk associated with YSO have been observed:
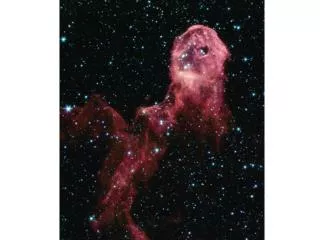
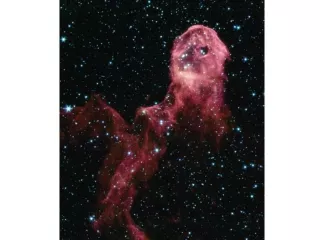
Silhouettes Dark shadow in contrast with the bright background in the Orion nebula
Proplyds Photoevaporated disks
Scattered light from the YSO Stapelfeldt et al Stellar light is scattered by the surface of the disk. Disk are not plane, but flared.
Gravitational collapse conserving E and J formation of a disk Material with highest J at largest r most of the mass of core lands on disk. Accretion mass to form the star, in two stages: cloud disk = infall disk star = accretion Relevant luminosities to be considered: potential energy released in: Linf (star): radial infall to the star Linf (disk): infall to the disk Linf ~ G (dMinf /dt) M*/R (R: radius where material lands; dMinf /dt:infall mass accretion rate; M*: stellar mass ) Lacc : accretion from disk onto the star L* : stellar luminosity Lobs: Observed luminosity All of them have to be estimated and compared to identify the accretion processes.
The mass infall rate can be estimated from the density of the infalling envelope model that produced the observed SED: Assuming spherical infall at large distances, by mass conservation: dMinf /dt = 4pr2rv, with v = vff = (GM*/r)1/2 Model for ClasI in Taurus MC dMinf /dt ~2- 4 x 10⁻⁶ Msol/yr Linf ~ 15-30 Lsol Linf >> L obs ~ 1Lsol “ENERGETIC PROBLEM” Actually, is not a problem If infall occurs onto the disk, as expected from angular momentum conservation, for typical disk radii Linf ~ 0.002-0.03Lsol
Accretion Disk • Disk formation during the collapse phase is followed by a longer phase of disk accretion: • Most of the disk mass will be accreted onto the star. • To conserve J, this phase requires to move a small fraction of disk particles at larger radial distances. • The subsequent evolution of the star-disk system will be controlled by the rate at which J is transported in the disk • (mechanisms not well known).
The “idea” of the accretion (from Lynden-Bell and Pringle (1974) Let be two particles of masses m1 and m2 orbiting around a central mass M: The energy, E and angular momentum, J are given by: By a perturbation of orbits, with conservation of momentum: The energy is minimized and the momentum conserved by moving closer to M the closest particle and far, the fartest particlebasic action of accretion disk: energy is released as material both accretes and spreads to a larger distances.
The procces requires some way of connecting different particles in the disk: Differential rotation: Energy is lost due to frictional dissipation: Net Eg of the system decreases: net motion of the disk mass, inward=>ACCRETION Conservation of J requires internal torques to transport material outwards: the gas has turbulent, random motions which cause mixing in radial direction of material with different specific angular momentum : MOMENTUM TRANSFER in terms of kinematic viscosity (Frank et al. 1992) Material at R position, with an angular velocity W(R) moves at R+DR Material at R+DR, with W(R+DR) < W(R) moves at R. Torque, dJ/dt ~ 2 pSn R3 dW/dR S: surface density; n : viscosity n ~ wl (characteristic velocity and scale length of turbulent motion) Use: n = a cs H (cs: sound speed; H scale height of disk) (Shakura y Sunnyaev 1973).
Diffusion of a ring of material t=0 1 mass: initially at R=R1 t >> R12/n: Most of J, far away Most of the mass, at centre
DISK LUMINOSITY • Energy loses due to viscosity (/surface): • D(R)=dE/dt=1/2 nS (R dW/dR)2 • For steady accretion, dM/dt = cte: • Total luminosity accreting from infinity : L = G M* (dM/dt)/R* • At R*, with a orbital velocity= (GM*/R*)1/2 , E = 1/2 G M* (dM/dt)/R* • Total luminosity emitted by the disk : Ldisk = ½ G M* (dM/dt)/R* • The energy is released in the boundary layer, where material stop
Boundary layer Schematic diagram of the angular velocity in the region where the disk reaches the stellar surface. The point where dW/dR =0 is assumed to be a small distance dR << R* . The narrow region where the disk material loses most of its rotational kinetic energy is the boundary layer
Temperature distribution of the disk For steady accretion (dM/dt =cte), dE/dt = D (R) is independent of n (viscosity). For a optically thick disk, its effective temperature Tvis(R) can be found assuming blackbody radiation of the disk D(R) = s Tvis4
Luminosity of the disk The luminosity as a function of n emitted by the disk Rdisk Ln = 2 p Bn (Tvis) 2 p R dR R* For optically-thick disk: High n : SED of blackbody at T of the hot inner edge of the disk. Low n : asymptotic behaviour n Lna n4/3 al-4/3
SED OF THE OPTICALLY-THICK STEADY DISK Hartmann 1998
Emission from standard steady disk • Could account for CTTS luminosity excess?: • Ldisk = ½ G M* (dM/dt)/R* • Luminonsity radiated by the boundary layer : Lbl= ½ G M* (dM/dt)/R*. • Assuming Lbl = 4 p R*2 f s Tbl4, • with f (fractioon of area) ~ 1% (~Rbl/R ) and Tbl ~ 8000K, for typical CTTS parameters: • Could account for energy excess as: IR and UV excess “veiling” • Could not account: Observed line-profiles
LINE PROFILES ARE NOT EXPLAINED • Volume of the boundary layer is not enough to account for the Ha fluxes observed • Radial velocities derived for the steady flux are appreciably lower than radial velocities measured from the redshifted absorption line feature.
MAGNETOSPHERIC ACCRETION Strength of stellar magnetic field, from Zeeman effect: Measure the broadening of magnetic sensitive lines Dlz ~l2g B (g: Lande factor) Also, from spectropolarimetry B=0 B ~ few kG Johns-Krull et al. (1999)
MAGNETOSPHERIC ACCRETION IN TTS The effects of stellar magnetic field cannot be neglected in understanding accretion onto TTS. For spherical (free-fall) accretion, assuming balance between magnetic pressure and ram pressure of accretion, when B2/8 p > ½ r v2 , the ionized accreting gas cannot fall freely, but halted by magnetic forces. Assuming with vinfall ~ vff ; dipolar field, B ~ r-3, Accretion is halted by magnetic field at a ”truncation radius” rt = 7 R* B4/7 (dM/dt) -2/7 M*-1/7 R*5/7 (B in 1 kG units, dM/dt in 10-8 Msol/yr, M* in 0.5 Msol and R* en 2 Rsol ) For star+disk, the ”truncation radius” Rt ~ g rt, (g <1, ~ 1/3 – 2/3) B (of star) truncates the disk at a few R* Matter falls onto the star along the field lines, essentially with free-fall velocity See Hartmann 1998, secs 8.11,8.12)
Scheme of line formation in the magnetospheric accretion flow • Most flux at line center comes from regions where matter is lifted from the disk (larger volume,v~0) . • The wings come from material approaching to the stellar surface • (line width~free-fall velocity at the stellar surface) • An acccretion shock is formed, emitting at much higher T than the stellar photosphere, when the material reaches the photosphere • Blueshifted emission comes from flow at the back of the star, falling in • Redshifted emission is formed if the line-of-sight crosses the infalling material in front of the hot accretion shock
Observed H and NaD line profiles in CTTS & magnetospheric accretion model observation model Muzerolle et al. 2001, ApJ, 550, 944
However,Ha line profiles of CTTS with the highest dM/dt are not well fitted. They are formed in a wind, in agreement with the characteristic P-Cygni profiles. dM/dt Muzerolle et al. 2001, ApJ, 550, 944
The accretion shock Calvet & Gullbring 1998, ApJ, 509,802 Material falling along magnetic field lines will reach the stellar surface at free-fall velocities. It has to slow down through a shock just above the stellar surface. Soft X rays from the shock heat the photosphere below, and the pre-shock region above along the accretion column. (Roughly, 0.5 Lsh is emitted in each direction) The heated material re-emitts the energy material in fre-fall – pre-shock X shock X Post-shock Hot photosphere Lsh =z Lacc, with z = (1-R*/Rt) Falling material at vff = (2GM*/R*)(1-R*/Rt)1/2 Lsh = GM*(dM/dt)/R* (1-R*/Rt)1/2 ~ 0.8 Lacc , Rt ~3-5 R* Accretion shock models based in these simple models can explain very well the optical and UV excess in CTTS. Thus, measure of Lacc from these excess and estimate of dM/dt
Accretion shock emission • Emission from shock can account for the UV flux excess. • By measuring the luminosity from the flux • ~ 0.8 G M* dM/dt / R* • From M* y R* using the position in the HR diagram • => dM/dt ! Gullbring et al. 2000, ApJ, 544, 927
Accretion shock models vs observations Accretion shock models fit the observed flux excess: F ~ 1010 – 1011 erg s-1 cm-2 Thp ~ 7000-9000 K f ~ 0.1-1% model Calvet & Gullbring 1998,ApJ, 509,802
Accretion rates in CTTS <dM/dt> ~ 10-8 Msol/yr In agrement with values used to estimate Rt Hartmann et al. 1998