Download
1 / 19
190 likes | 284 Vues
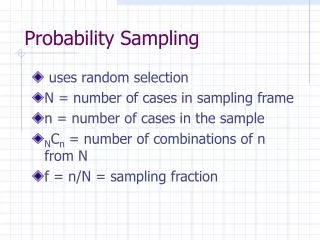
PSY 1950 Chance, Probability, and Sampling September 24, 2008. vs. Probability: Perspectives. Analytic: possible outcomes theoretical Relative frequency: past performance empirical Subjective: belief Psychological. Probability: Applications. Is data-generating process random? Yes

E N D
PSY 1950 Chance, Probability, and Sampling September 24, 2008
Probability: Perspectives • Analytic: possible outcomes • theoretical • Relative frequency: past performance • empirical • Subjective: belief • Psychological
Probability: Applications • Is data-generating process random? • Yes • Debunk or study psychological bias to see patterns • Chance is lumpy, brains are pattern-detectors • e.g., bushy tiger vs. tigery bush • e.g., hot hand in basketball • Debunk patterns vs. affirming randomness • No • Pattern demands explanation
Probability as Area NORMDIST(x, mean, standard_dev, cumulative) NORMSDIST(z) NORMINV(probability, mean, standard_dev) NORMSINV(probability)
Why The Normal Distribution? • Variables are often (or are often assumed to be) normally distributed in population • e.g., Quetelet’s (1835) measurements of heights • e.g., IQ scores • Errors are often (or are often assumed to be) normally distributed • Sampling error (cf. terminology: normal, error) • Assuming (approximate) normality allows inference • Assuming normality enables parametric statistics • Normal distributions have “amazing” mathematical properties • Linear combinations of scores from two normally distributed variables are themselves normally distributed!
Binomial Distribution • Two possible outcomes • Constant outcome probability • Trial-to-trial independence • If pn and qn 10:
Binomial Distribution http://www.socr.ucla.edu/htmls/SOCR_Distributions.html
Example: Missing girls • 1049 males are born in the world for every 1000 females. From 2000-2005, there were approximately 17 million children born in China, approximately 7,730,000 of whom were female. What are the odds that this is by chance?
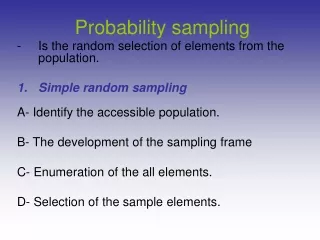
Sampling • Overconfidence abhors uncertainty • Law of small numbers • Correspondence bias • Overconfidence bias • Bias • e.g., Who likes statistics? • Characteristics of sample: representativeness • Measurement of sample: response, non-response • e.g., How many children in your family • Sampling unit: people vs. families • Only family with children are represented • Families with multiples children are overrepresented • How would you obtain a representative sample?
Sampling Terms • Sampling error • Variability of a statistic from sample to sample due to chance • Sampling distribution • The distribution of a statistic over repeated sampling from a specified population
Standard Error (of the Mean) • Standard deviation of the distribution of sample means • Estimate of how well, on the average, a sample mean estimates its population mean • Expected error • Depends on sample size • Law of large numbers • Depends on population variability • Is not standard deviation of sample (s) or distribution ()
Standard Error vs Standard Deviation • Standard deviation • Descriptive statistic • Measure of dispersion • Standard distance between scores and their mean • Does not depend on sample size • Standard error (of the mean) • Inferential statistic* • Measure of precision • Standard distance between sample means and population mean • Depends on sample size • Standard error is type of standard deviation • Equal when n = 1
Central Limit Theorem • For any population with mean and standard deviation , the distribution of sample means for sample size n will: • have a mean of • have a standard deviation of /√n • will approach a normal distribution as n approaches infinity • Valid for any population • Explains normal distribution of many psychological variables • Distribution of sample means approaches normal distribution very quickly (n 30)
Central Limit Theorem Sampling distribution (CLT) experiment http://www.socr.ucla.edu/htmls/SOCR_Experiments.html • Examine mean, standard deviation, skewness, and kurtosis of sample mean • Try different sample sizes • Try other sample statistics (e.g., variance) • Sampling from different (e.g., Poisson) distributions