Download
1 / 9
90 likes | 175 Vues
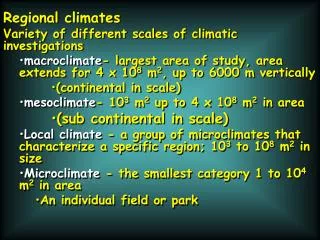
Case study III The continental scale: home ranges. Species differ in home range Home ranges may be continuous or scattered. Scattered distributions might not allow for any gene flow. Such regional subpopulation quickly evolve into new species .

E N D
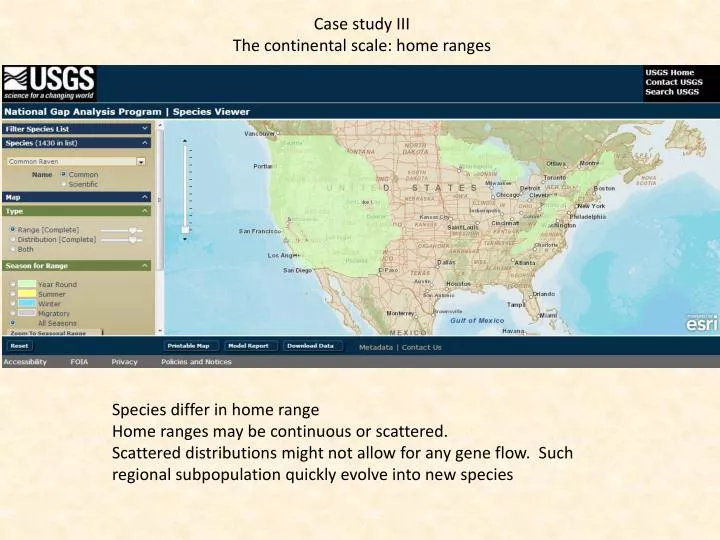
Case study III The continental scale: home ranges Species differ in home range Home ranges may be continuous or scattered. Scattered distributions might not allow for any gene flow. Such regional subpopulation quickly evolve into new species
Many species have seasonal migrations. Then summer and winter home ranges differ.
The UTM grid of Poland used for species distribution atlases No gene flow Regression analysis with environmental factors allows for the assessment of habitat preferences. Relict species Introduced species Habitat specialists Philaeus chrysops
Case study III The continental scale: home ranges olocene Miocene Pliocene Pleistocene H S Alps Podarcis muralis C Balkans E France Languedoc W France Marche Venetian Romagna Tuscany Calabria P. liolepis P. lsiculus P. melidellensis Substitutions How did Podarcismuraliscolonise Europe aft the glacial period? How will the species spread in the face of climate change?
Species distribution modelling (MaxEnt) under five different climatic scenarios
Colonisation gradient Sites sorted according to allele richness Sites sorted according to distance from Athens Founder effects Ordered genetic loss Popu-lations The map of 144 alleles from 10 loci spread across 20 sites from southern and western Europe Relict populations Vicariant (scattered) genetic loss The mean number of elleles per locus decreases with distance from Greece
A nestedpatternof allele loss with unexpectedabsences and presences A perfectlynestedpatternof allele loss Rows and columnsaresortedaccording to speciesrichness Unexpectedabsences Unexpectedpresences A matrixsorted to maximise the number of occurrencesalong the diagonale reveals the degree of allele turnover in the population A randommatrix
The ordered (nested) loss of alleles along putative cpolonisation gradients Eastern limeage with ordered loss of alleles along the colonisation gradient Western limeage with ordered loss of alleles along the colonisation gradient Intermediate situation
Balkans and Italy Seriation : sorting the matrix according to reciprocal averaging. Occurrences are maximised along the matrix diagonal. Eastern and western clades do not completely overlap in allele distribution. Apparently we have two postglacial colonisation trajectories: from Spain and from the Balkans. olocene Pleistocene H S Alps C Balkans Eastern Clade E France Languedoc W France 0.4 my Western Clade Marche Venetian Italian Clade Romagna Tuscany Western France Calabria 1.2 my