Download
1 / 20
200 likes | 326 Vues
Radar-Derived Precipitation Part 2. I. Radar Representation of Precipitation II. WSR-88D, PPS III. PPS Adjustment, Limitations IV. Effective Use. COMET Hydrometeorology 00-1 Matt Kelsch Tuesday, 19 October 1999 kelsch@comet.ucar.edu.

E N D
Radar-Derived PrecipitationPart 2 I. Radar Representation of Precipitation II. WSR-88D, PPS III. PPS Adjustment, Limitations IV. Effective Use COMET Hydrometeorology 00-1 Matt Kelsch Tuesday, 19 October 1999 kelsch@comet.ucar.edu
III. Stage I WSR-88DPrecipitation Processing System (PPS) • Data Sources • The 5 module sequence • Understanding the rainfall estimates • Recognizing limitations of radar • Recognizing limitations of gauges • Effective use of PPS guidance • Examples/Cases
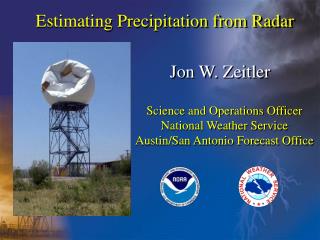
Stage I PPS Data Sources • Rain Gauge Data - these provide point source measurements of accumulated precipitation for discrete time intervals. They are explicitly representative only of their immediate environment. Gage quality varies from site to site. • Radar Estimates of Precipitation - these provide areal estimates of precipitation for discrete time intervals. These estimates are based on the conversion of returned power backscattered from precipitation and other particles to rainfall rates. Resolution is a function of characteristics of the radar beam. Radar quality is more uniform. Radar maintenance more controllable.
Stage I PPSFive-Algorithm Sequence 1. Preprocessing: constructs “hybrid” scan (1oX 2 km)from 4 low-level tilts. • Removes clutter and outliers • Checks for Anomalous Propagation 2. Rate: converts reflectivity to rainfall rate. • Uses Z-R relation, Z = 300*R1.4 • Quality control checks performed • Maximum reflectivity cap applied (removed in Build 9) • Maximum rainfall rate cap applied (Build 9) 3. Accumulation: integrates rainfall rates into scan-to-scan and hourly accumulations.
Stage I PPSFive-algorithm Sequence (cont.) 4. Adjustment: calibrates radar using rain gauges. • Adjusts for systematic, large-scale bias • Depends on representative gauge reports 5. Products: generates ~2 X 2 km (1oX 2 km) products for display. • 1-h accumulation updated every volume scan • 3-h accumulation updated at the clockhour • Storm total accumulation every volume scan
Stage I PPS Module l: Precipitation Processing • “Hybrid” scan designed to keep data at a relatively constant elevation above the ground. The final 1 x 1 km product has AP and clutter suppressed. • Successively lower tilt angles used as distance from the radar increases • Lowest two tilts are used beyond 50 km and compared to determine if the lower is contaminated (AP or clutter) • Sectorization may assist with terrain clutter • Isolated reflectivity outliers. • 8 nearest-neighbor average for outliers
IV. Stage I PPSModule 2: Precipitation Rate Instantaneous rainfall rates are derived with a 1 x 2 km resolution from the hybrid reflectivity scan • Z = 300*R1.4, R is mm/h • Each 1 x 2 km rainfall rate bin is derived from two 1 x 1 km hybrid reflectivity bins • The maximum rainfall rate threshold is applied (~4.00 in/ hr) Quality control check for reasonable change in area/magnitude with time.
Z-R Relationships • Rainfall rates (R) are directly related to the drop size distribution of precipitation (based on the diameter cubed). • Reflectivity (Z) is directly related to the drop size distribution of precipitation (based on the diameter to the sixth power). • If the drop size distribution were known, the relationship between Z and R could be calculated. It is not known, so no unique relationship between Z and R can be defined. Instead empirical relationships have been developed.
Z-R RelationshipsWSR-88D, Marshall-Palmer (general), and Tropical