Download
1 / 8
80 likes | 145 Vues
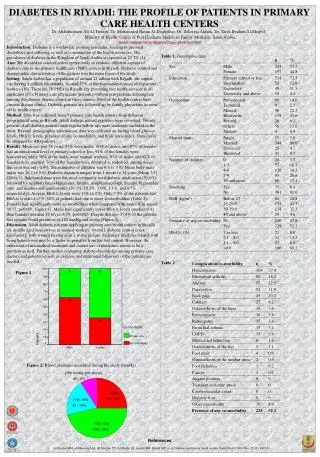
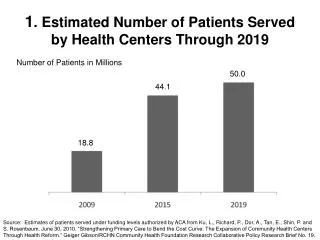
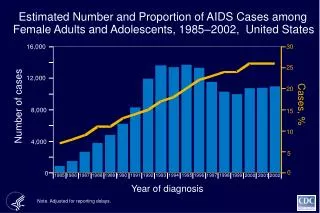
1 . Estimated Number of Patients Served by Health Centers Through 2019. Number of Patients in Millions. 50.0. 44.1. 18.8.

E N D
1. Estimated Number of Patients Served by Health Centers Through 2019 Number of Patients in Millions 50.0 44.1 18.8 Source: Estimates of patients served under funding levels authorized by ACA from Ku, L., Richard, P., Dor, A., Tan, E., Shin, P. and S. Rosenbaum. June 30, 2010. “Strengthening Primary Care to Bend the Cost Curve: The Expansion of Community Health Centers Through Health Reform.” Geiger Gibson/RCHN Community Health Foundation Research Collaborative Policy Research Brief No. 19.
2. Health Center Patients by Source of Insurance, 2010 and 2019 SOURCE: Ku L et al., Strengthening Primary Care to Bend the Cost Curve: The Strengthening of Community Health Centers Through Health Reform. Geiger Gibson/RCHN Community Health Research Collaborative, 2010. Total = 19.5 million Total = 40 million
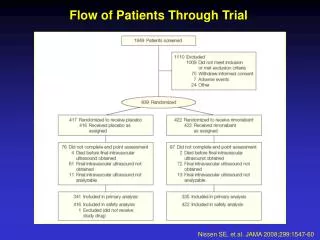
3. Physician Visits Involving Treatment of Chronic Conditions, Health Centers vs. Office-Based Physicians Note: Difference measured relative to office-based physicians. ***p<.01, **p<.05, *p<.10 SOURCE: Estimates based on combined sample of visits to office-based physicians from National Ambulatory Medical Care Survey (NAMCS) for 2006-2009. “Common chronic conditions” means primary diagnosis for visit is coded as hypertension, asthma, diabetes, heart disease, and selected psychotic conditions and other psychoses. Excludes “pre/post surgical” visits, visits to non-primary care physicians, and visits in which patient did not see a physician. Physician visits involving treatment of common chronic conditions Physician visits involving treatment of specified chronic condition
4. Health Center Caseloads Rose, While Percent of Health Center Patients Without Insurance Fell 482,503 446,559 431,005 19% 18% 18% 19% 8% 7% 7% 42% 42% 42% 42% 38% 5% 33% 36% 26% Number of Patients 4 Note: Comm Care and Other Public served 1% in 2005 and <1% in 2006 Source: GW analysis of Massachusetts Uniform Data System data
5. Percentage of UninsuredLow-income Adults at Health Centers Fell in 2007, but Health Center Patients Still More Likely to be Uninsured Source: Health center data from UDS. Statewide from Long 2008 & Census 2008. 5
6. Percent of Total Statewide Uninsured Receiving Care at Health Centers Rose in 2007 % of Uninsured Who Are Patients at Health Centers 2007 2006 6 Source: GW analysis of Uniform Data System and Census data
Growth of Health Center Appropriations in Nominal vs. Real Dollars, 1980-2010 Note: In 2010 dollars, adjusted by Medical Care Services CPI. SOURCE: 1980-1995 data from National Association of Community Health Centers; 2000-2010 UDS data, HRSA. Appropriations (billions) Medicaid expansions for pregnant women and children (1984-1990) FQHC payments OBRA (1990) Bush Administration expansions (2002-2008) ARRA (2009-2010) Health centers: 872 694 1,002 722 630 530 1,124 Patients (millions): 9.6 5.0 5.3 14.1 6.0 7.7 19.4
Federal Health Center Funding, FY 2008-2013 Note: HCTF = Health Center Trust Fund. Fiscal year funding in nominal dollars. Does not include the $1.5 billion of the HCTF committed for capital projects (of which $750 million is remaining). SOURCE: 2008 and 2010 data from UDS, HRSA; 2011-2013 based on allocation specified in ACA. $ in billions (Proposed)