Download
1 / 11
110 likes | 119 Vues
Considering model structure of covariates to estimate propensity scores. Qiu Wang. Propensity Score. Definition (Rosenbaum & Rubin, 1983) The propensity score is the conditional probability of assignment to a particular treatment given a vector of observed covariates.

E N D
Considering model structure of covariates to estimate propensity scores Qiu Wang
Propensity Score • Definition (Rosenbaum & Rubin, 1983) The propensity score is the conditional probability of assignment to a particular treatment given a vector of observed covariates. • The authors defined the propensity score as e(x) = pr (z = 1 |x). The function e(x) was called the propensity score because it is indicating the propensity towards exposure to treatment 1 given the observed covariates x.
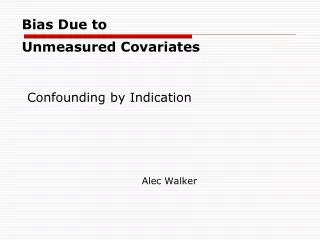
Why use propensity score • In randomized experiments, the results from two groups (e.g. treatment vs. control groups) are ready to be directly compared because their units are likely to be similar due to the systematic control of covariates. • Correspondingly, the causal inference can be conducted convincingly. However, in nonrandomized studies, direct comparisons between groups may be misleading because of the lack of randomization control and possible systematical difference of the partisans in the groups.
Estimate propensity scores • Logit model (Cox, 1970; see Rosenbaum & Rubin, 1985) q(x)=log [(1-e(x)/e(x))]= a + bTf(x) Implies, e(x)=(1+e a + bTf(x))-1, which is the predicted probability for the logistic regression.
How to use Propensity Score for group matching • Using exact value of • Nearest neighbors (values) (Rosenbaum & Rubin, 1985) • Mahalahobis distance (Rosenbaum & Rubin, 1985) • 5-subclasses based upon minimum, lower quartile, median, upper quartile, maximum
Generalized propensity scores • e(x) is a function of x. Does other function fit the role of matching groups? • Yes. Such as X is itself. For example, use the mean of Xi to match two groups. • Or, a linear function of X. E(X|1) • Or, nonlinear function of X, such as Rosenbaum & Rubin’s (1985) quadratic regression which implies f(x)=(1,x)T(1,x)
Model based propensity scores • Rosenbaum (1987; 2004) for multiple-group matching .
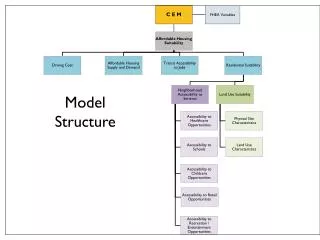
Considering Nested covariates X • X’s are mixture of level one and level two covariates. • The level one slopes may vary across level two units. Q1: Dose the structure of X affect estimated propensity scores? Q: How nested-structure based propensity scores affect group matching effect?
Research procedure • Finding a data used by Rosenbaum; • Model a random logistic regression, such as HLM to estimate propensity score; • Compare the group matching effect of HLM based propensity scores to traditional methods mentioned above. • Use large scale data set such as NELS:88’s drop out data
Cont. • 4.1 re-think the relationship of drop out rate and race. • 4.2 use propensity scores to match dropouts • 4.3 Find out the heterogeneity and homogeneity across racial groups of dropouts. • 4.4 draw conclusions based on 4.3.
Possible simulation study • Plan 1. sample size: level 1 and level 2 2. variance and covariance matrix t Any inputs will be highly appreciated!